The storage analysis feature in PolarDB for PostgreSQL quick diagnostics — powered by Database Autonomy Service (DAS) — gives you a consolidated view of your cluster's storage health. Use it to track overall storage consumption, estimate how many days of capacity remain, and pinpoint storage anomalies at the database and table level.
Limits
Storage analysis supports up to 20,000 tables.
Analyze cluster storage
Log on to the PolarDB console, select the region where the cluster is deployed, and click the cluster ID in the Clusters list to go to the basic information page.
In the left-side navigation pane, choose Diagnostics and Optimization > Quick Diagnostics.
Click the Storage Analysis tab.
On the Storage Analysis page, choose a tab based on what you want to view:
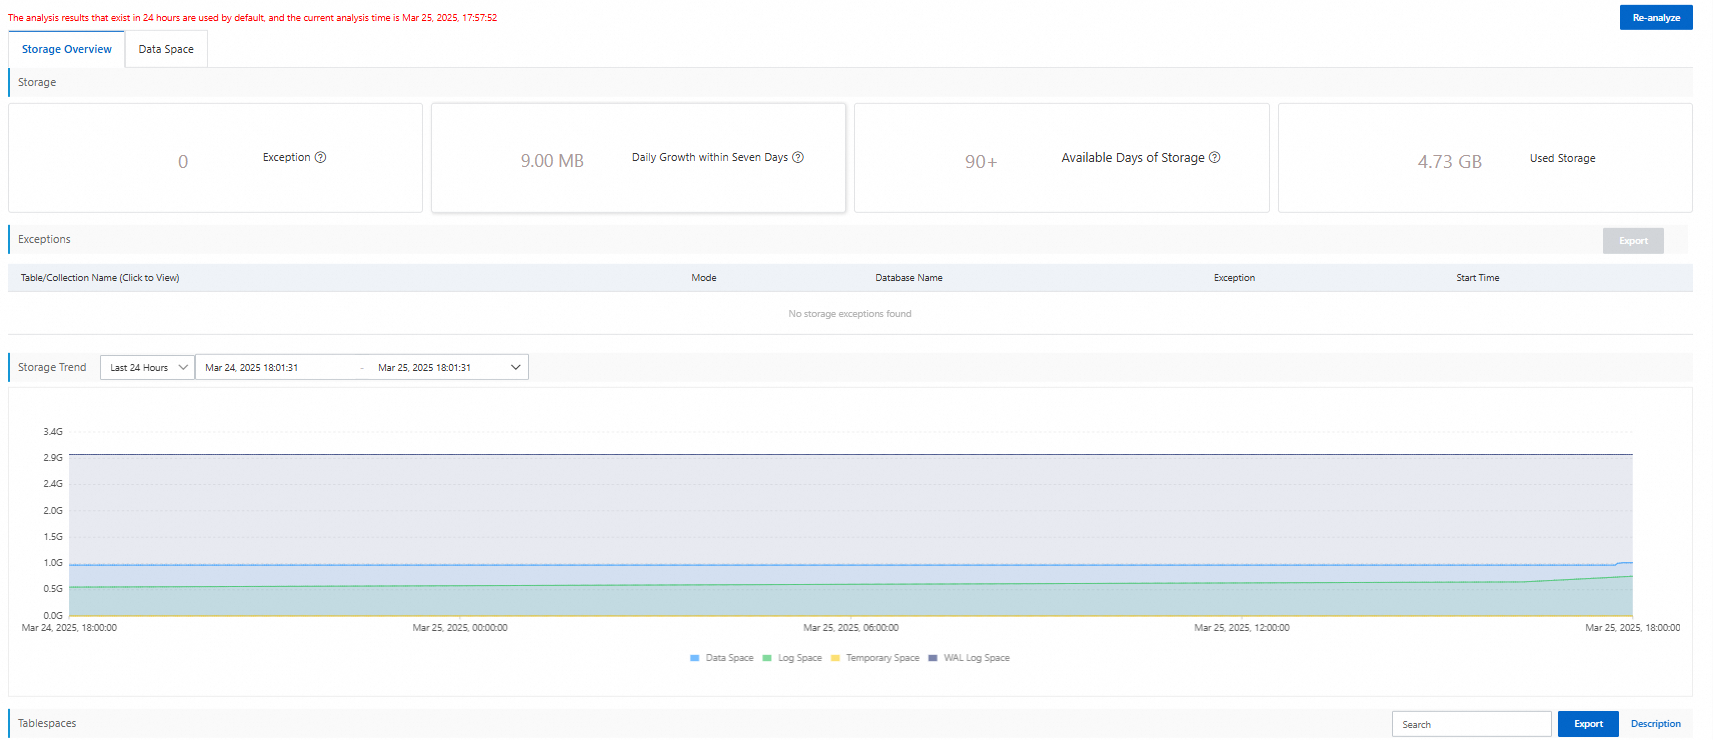
Storage Overview: View the overall storage status and usage trends of the cluster, including remaining capacity and the estimated number of days before storage is exhausted.
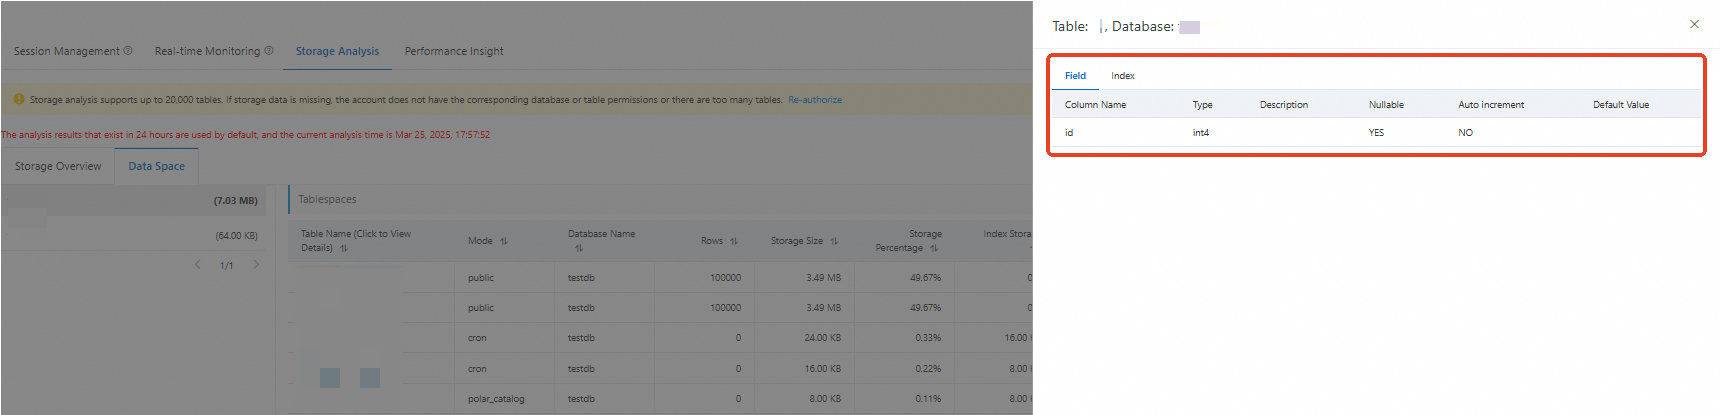
Data Space: View storage usage broken down by database and table. Click a table name to inspect its fields and indexes.