Use Session Management to monitor active and exceptional sessions, track CPU utilization, and terminate problem sessions in your PolarDB for PostgreSQL cluster. Session Management is part of the Quick Diagnostics feature, which integrates with Database Autonomy Service (DAS).
Prerequisites
Before you begin, ensure that you have:
A PolarDB for PostgreSQL cluster
Access to the PolarDB console
View and manage sessions
Log on to the PolarDB console. In the left-side navigation pane, click Clusters. Select a region in the upper-left corner, then click the cluster ID to go to the Basic Information page.
In the left-side navigation pane, choose Diagnostics and Optimization > Quick Diagnostics.
Click the Session Management tab.

Use the following sections to diagnose session issues:
Instance Sessions: Displays exceptional sessions, active sessions, and CPU utilization. Use this section first: check CPU utilization to identify load spikes, then review active and exceptional sessions to pinpoint the source.
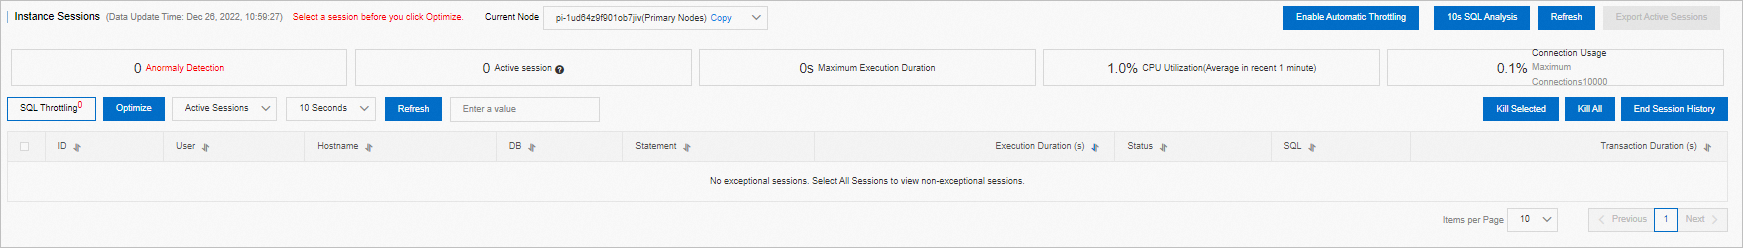 Note
NoteWhen you run an SQL request, an exceptional session may occur. Select the exceptional session and click Kill Selected to terminate it.
Session Statistics: Displays the total number of sessions, session runtime, and other session statistics collected based on different metrics. For example, the system calculates the number of sessions initiated by different users.
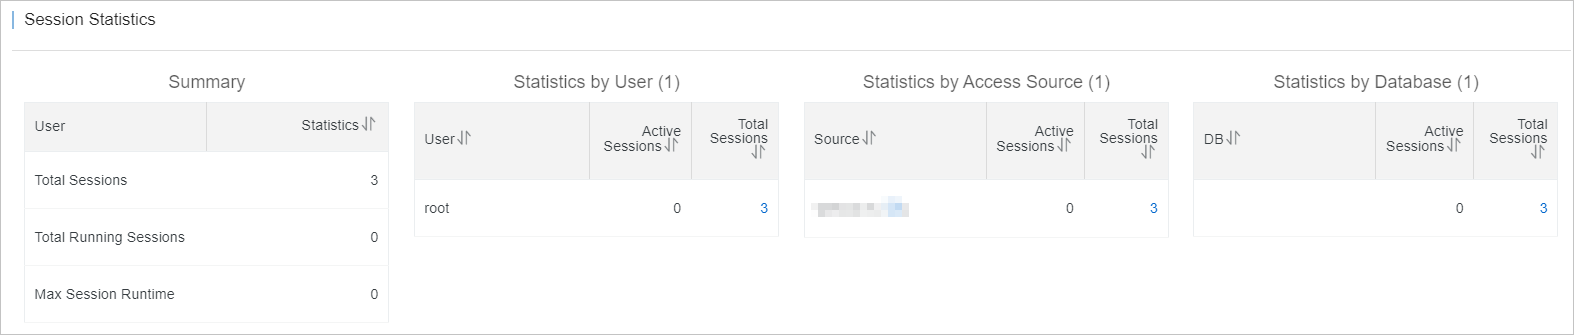 Use this section to identify whether a specific user or long-running group of sessions is contributing to the load you observed in Instance Sessions.