PolarDB provides built-in metric statistics that give you visibility into overall database usage and help you identify performance issues. The statistics cover four areas:
SQL statements — query execution activity
Tables — access patterns and usage for each table
Indexes — index access and efficiency data
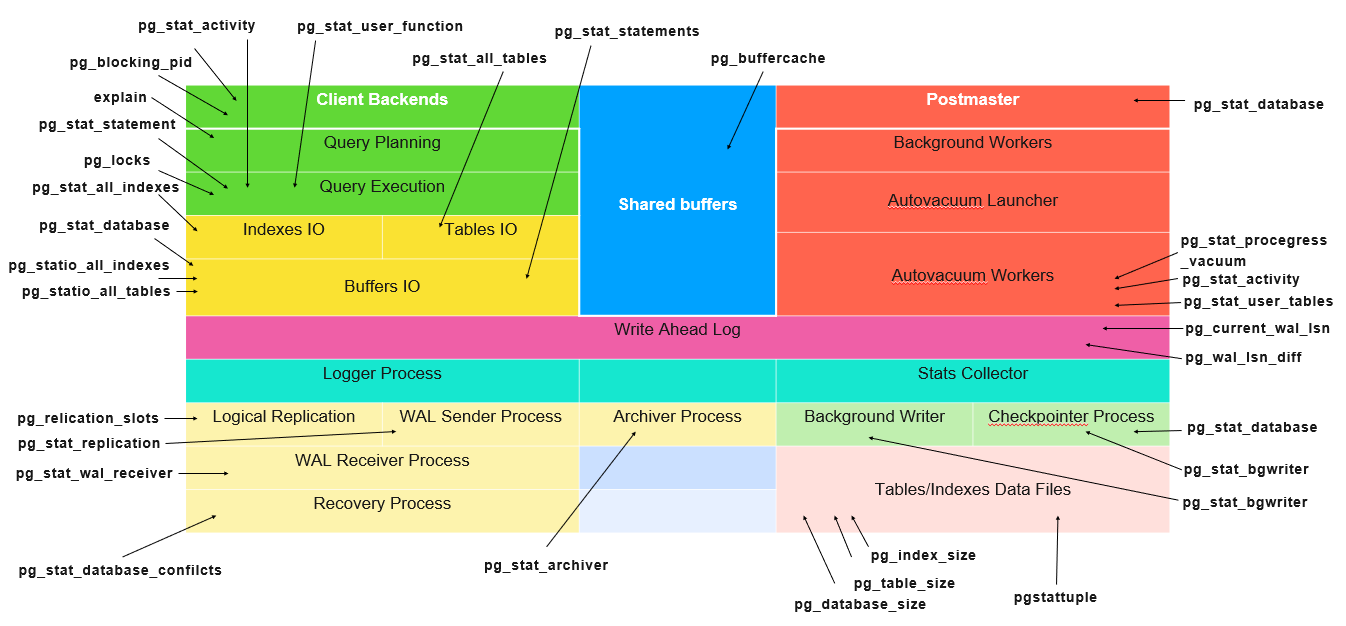
Background processes — status and activity of server processes
The following diagram shows all monitored metrics. Use it as a reference when troubleshooting performance issues.
Query the statistics views
Query the statistics views directly to retrieve detailed instance data. For a full list of available views and how to use them, see Check the views of PolarDB.