Use the plprofiler plug-in to profile Procedural Language/PostgreSQL (PL/pgSQL) functions and stored procedures on a PolarDB for PostgreSQL (Compatible with Oracle) cluster. plprofiler collects execution data at the statement level and renders it as a flame graph, so you can immediately see which function or statement is consuming the most time.
For background on the plug-in, see the plprofiler GitHub documentation.
Why PL/pgSQL performance is hard to diagnose
PL/pgSQL code runs inside the PostgreSQL server as a black box — you cannot observe which function is slow just by looking at query logs. Common symptoms include:
A function runs fast at first but slows down after many executions.
Bottlenecks appear randomly and disappear before you can investigate.
Performance problems only surface in the production environment.
Traditional approaches — manually reviewing schemas, statistics, and SQL, or using the pldebugger plug-in — are time-consuming and produce output that is difficult to interpret.
Prerequisites
Before you begin, ensure that you have:
A PolarDB for PostgreSQL (Compatible with Oracle) cluster with a reachable endpoint
Python installed on a Linux or macOS machine
The instructions in this topic apply to Linux and macOS only.
Set up plprofiler
plprofiler has two components: a PostgreSQL extension that runs inside your cluster, and a Python client that you run locally to submit profiling commands and generate reports.
Step 1: Install the Python client
Install the client directly with pip:
pip install plprofilerAlternatively, build from source:
git clone https://github.com/bigsql/plprofiler
export PLPROFILER_PATH=<path-to-plprofiler>
export USE_PGXS=1
cd $PLPROFILER_PATH/python-plprofiler
python setup.py install
Step 2: Set connection environment variables
Export your cluster connection details so that the plprofiler client and psql can reach your cluster without repeating credentials in each command:
export PGHOST=<polardb_host>
export PGPORT=<polardb_port>
export PGUSER=<polardb_user>
export PGPASSWORD=<polardb_password>
export PGDATABASE=pgbench_plprofiler
export PATH=$PLPROFILER_PATH/bin:$PATH   # only needed when building from source
Replace each placeholder with your actual cluster connection details.
Step 3: Create the database and extension
Log on to your cluster and run:
CREATE DATABASE pgbench_plprofiler;
\c pgbench_plprofiler
CREATE EXTENSION plprofiler;
Step 4: Prepare test data
Load the example tables, data, and functions provided with the plprofiler source:
cd $PLPROFILER_PATH/examples
bash prepdb.sh
Profile a function and read the results
Run the profiler
Run plprofiler against the example tpcb function and write the report to an HTML file:
plprofiler run --command "SELECT tpcb(1, 2, 3, -42)" --output tpcb-test1.html| Parameter | Description | Example |
|---|---|---|
--command | SQL command to profile | "SELECT tpcb(1, 2, 3, -42)" |
--output | Path for the generated HTML report | tpcb-test1.html |
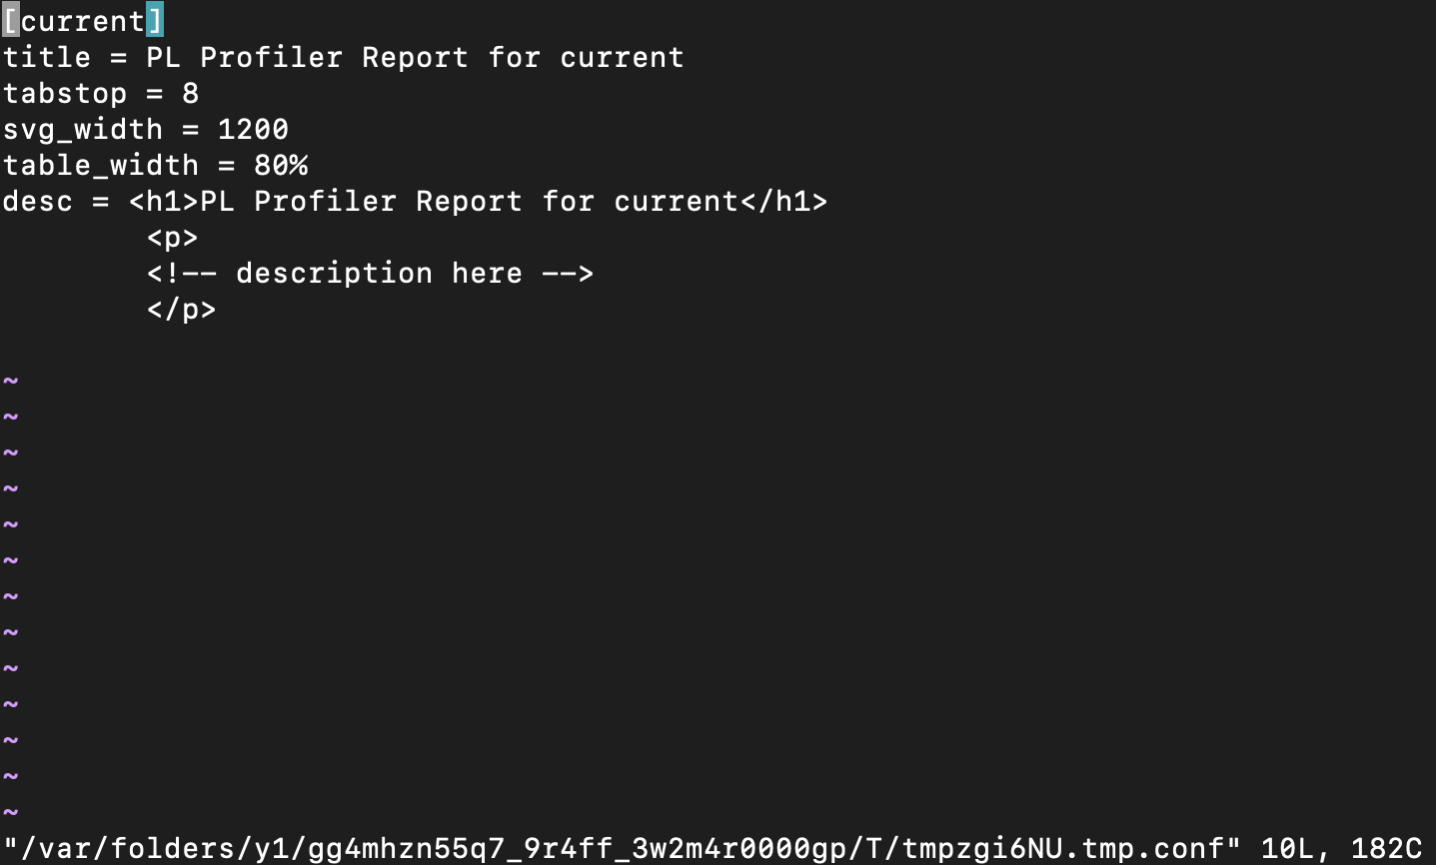
After the command runs, plprofiler opens the report in your editor, showing metadata fields such as title, height, width, and description. Exit without changes to keep the defaults.
Read the flame graph
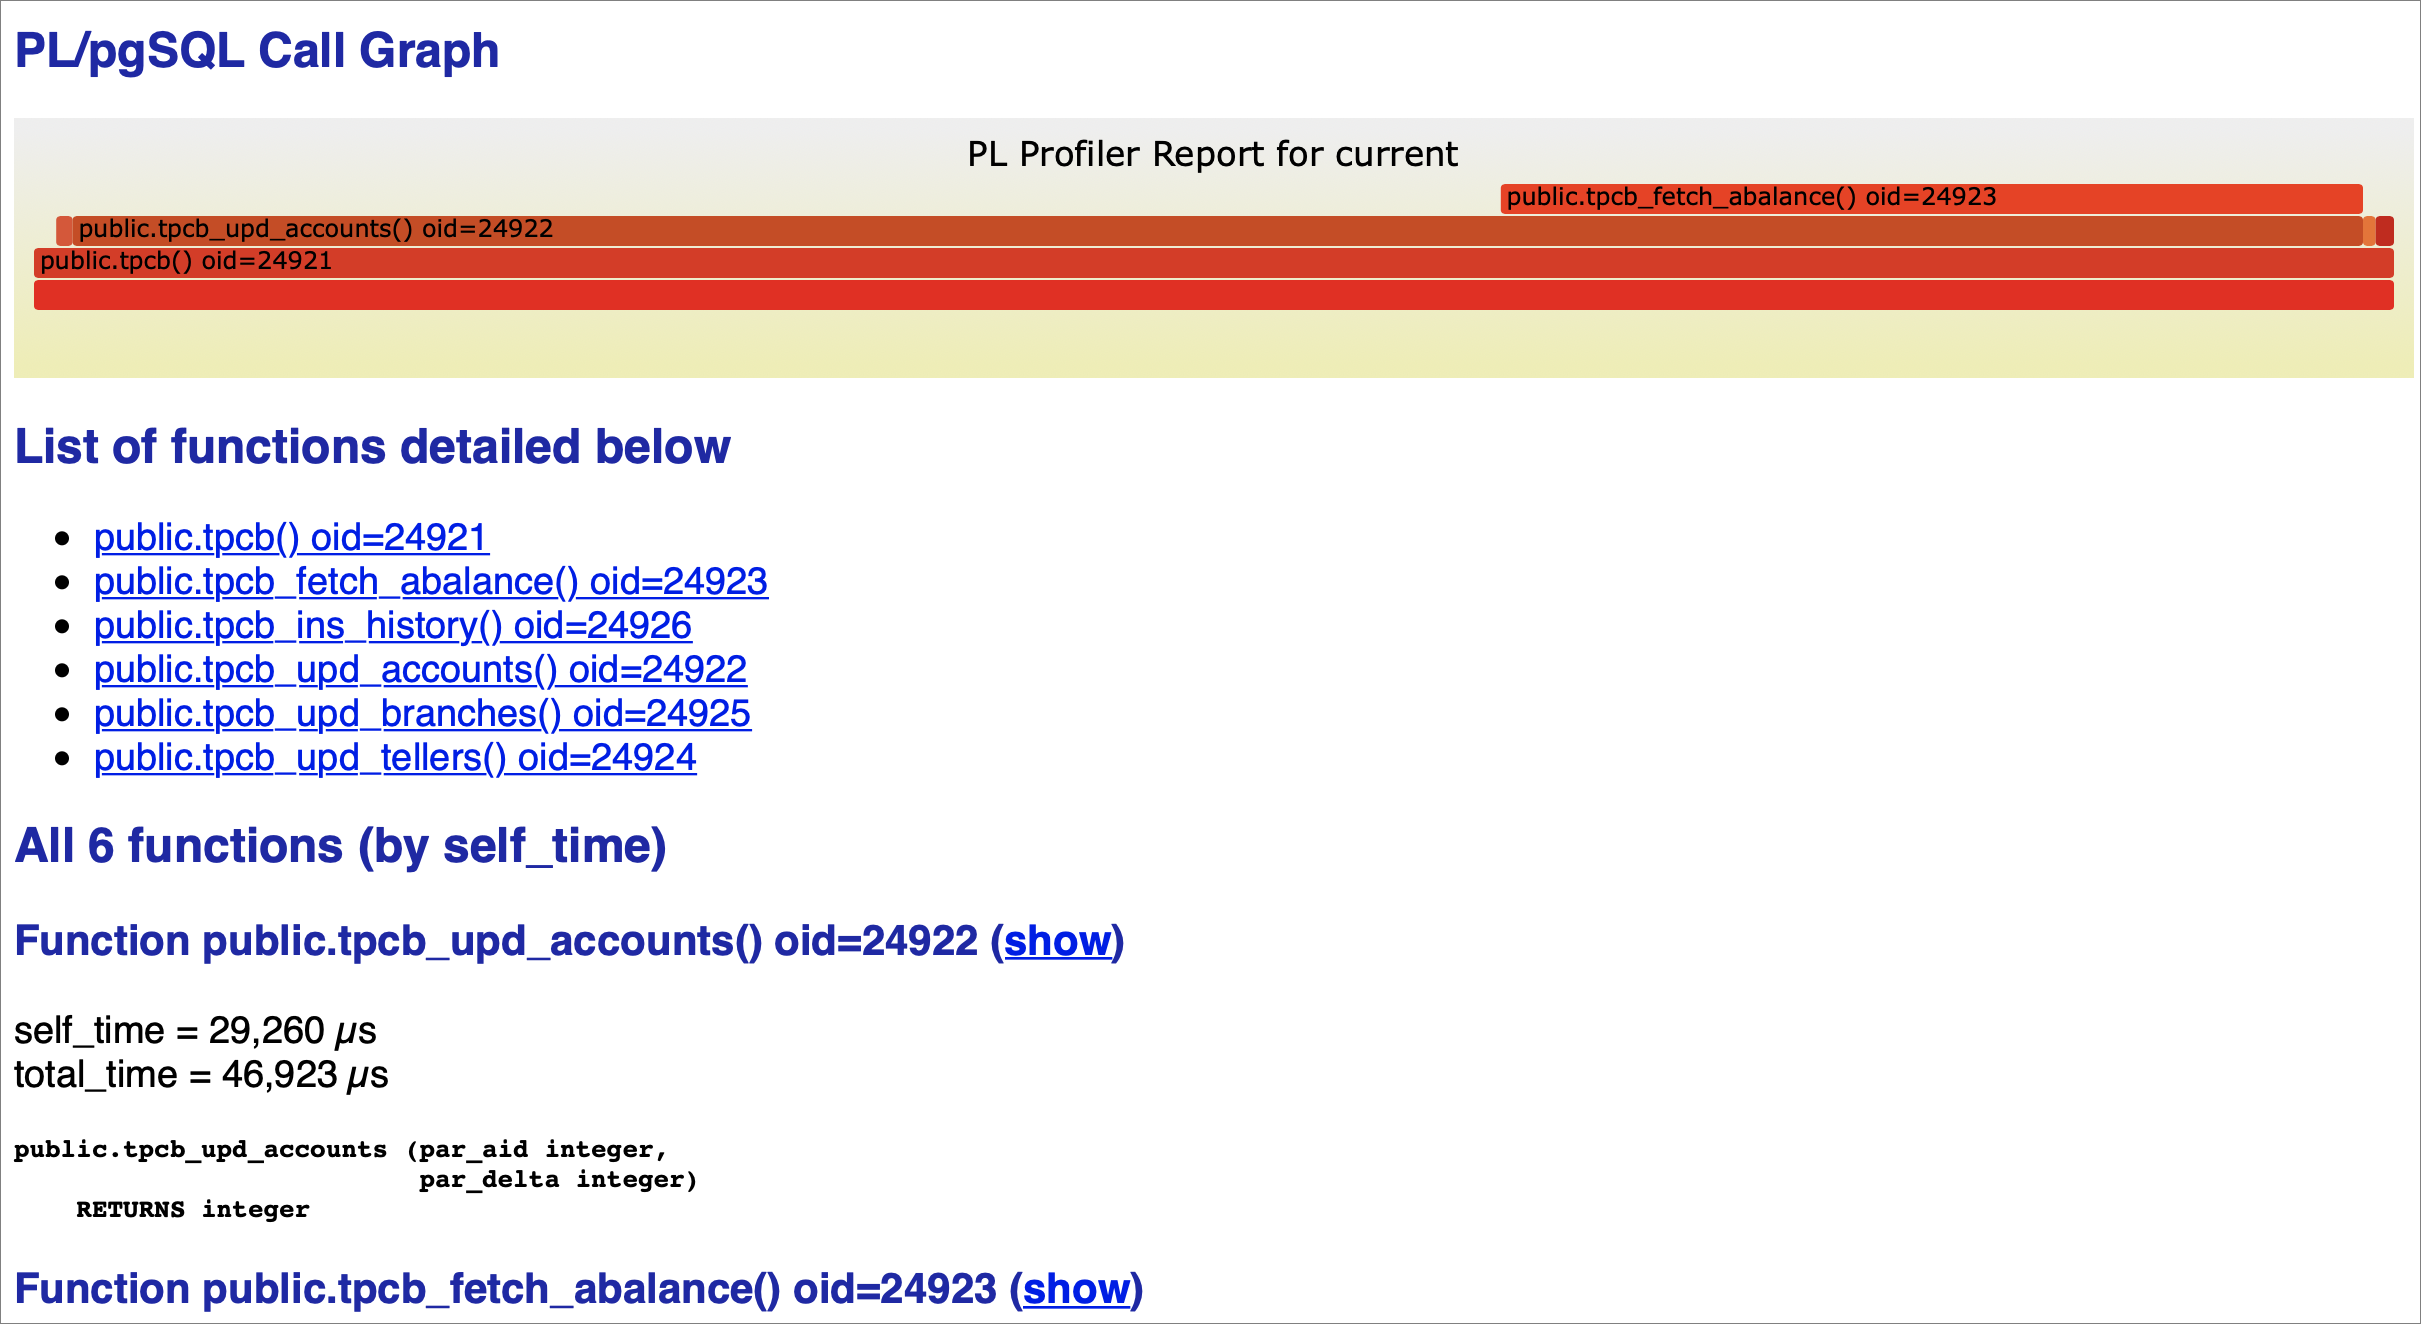
Open tpcb-test1.html in a browser. The flame graph at the top of the report shows which functions consumed the most execution time. Wider bars indicate higher time consumption.
In the example report below, tpcb_fetch_abalance has the widest bar, which points to a missing index as the likely cause. tpcb_upd_accounts also appears wide, but this may be because it calls tpcb_fetch_abalance — investigate the child function first.
Fix the bottleneck and verify
Create an index on the column accessed by tpcb_fetch_abalance:
psql
CREATE INDEX pgbench_accounts_aid_idx ON pgbench_accounts (aid);
Run the profiler again with the same command:
plprofiler run --command "SELECT tpcb(1, 2, 3, -42)" --output tpcb-test2.htmlOpen tpcb-test2.html in your browser. In the updated flame graph, tpcb_fetch_abalance is no longer the widest bar, confirming that the index resolved the bottleneck. The execution time for tpcb_upd_accounts also decreases because its child function now runs faster.
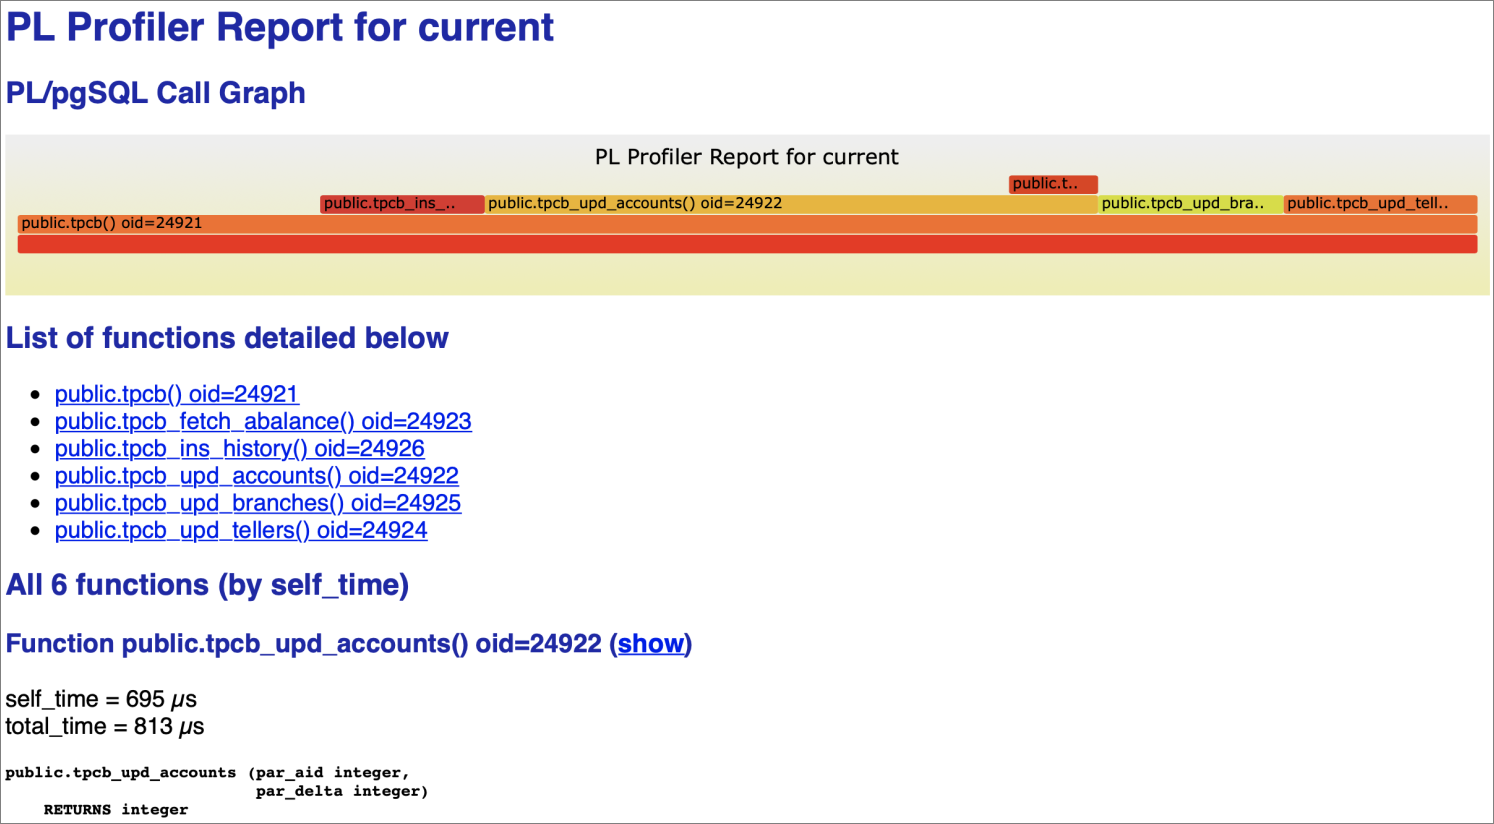
If the result meets your expectations, the optimization is complete. If other functions now appear as the dominant bars, repeat the identify-fix-verify cycle using the new flame graph.
What's next
View or apply for an endpoint — get the connection details for your cluster
plprofiler GitHub documentation — full reference for additional profiling modes, including application instrumentation and live production monitoring