Pre-tiling remote sensing imagery requires significant time, storage, and re-processing after every data update. GanosBase's ST_AsTile function eliminates this pipeline by generating standard map tiles on demand directly from raster data stored in PolarDB — no pre-tiling job, no GeoServer, no tile cache to maintain.
How it works
After raster data is imported into the database, ST_AsTile handles cropping, reprojection, resampling, and rendering at query time. For each requested tile coordinate (Z/X/Y), the function outputs a 256×256 or 512×512 PNG, JPEG, or GeoTIFF tile within hundreds of milliseconds — fast enough for interactive map browsing.
Because tiles are generated from live data, updates to the source raster are immediately visible without re-running a tiling job.
ST_AsTile operates on a single raster object at a time. To view multiple images simultaneously, mosaic them into a single virtual raster first (see Step 1: Prepare the data).Prerequisites
Before you begin, make sure you have:
-
A PolarDB instance with the following configuration:
-
Database engine: Oracle syntax compatibility 2.0
-
Kernel version: 2.0.14.25.0
-
Recommended specs: CPU > 4 cores, memory > 16 GB, disk > 50 GB
-
-
GanosBase version 6.3 or later, with the
ganos_rasterextension installed:CREATE EXTENSION ganos_raster CASCADE; -
Four Landsat 8 satellite images in
.TIFformat, uploaded to an Object Storage Service (OSS) bucket in the same region as your PolarDB instance
Your PolarDB cluster must connect to OSS through the internal endpoint. OSS and PolarDB must be in the same region.
Step 1: Prepare the data
Load the images
Create a table to store your raster data, then import each image from OSS using ST_ImportFrom.
CREATE TABLE landsat8 (
  id integer,
  rast raster
);

INSERT INTO landsat8 VALUES (1, ST_ImportFrom('chunk_table', 'OSS://<access_id>:<secret_key>@<endpoint>/<bucket>/path_to/file1.TIF'));
INSERT INTO landsat8 VALUES (2, ST_ImportFrom('chunk_table', 'OSS://<access_id>:<secret_key>@<endpoint>/<bucket>/path_to/file2.TIF'));
INSERT INTO landsat8 VALUES (3, ST_ImportFrom('chunk_table', 'OSS://<access_id>:<secret_key>@<endpoint>/<bucket>/path_to/file3.TIF'));
INSERT INTO landsat8 VALUES (4, ST_ImportFrom('chunk_table', 'OSS://<access_id>:<secret_key>@<endpoint>/<bucket>/path_to/file4.TIF'));
Replace <access_id>, <secret_key>, <endpoint>, and <bucket> with your actual OSS credentials and path. Do not include angle brackets in the final connection string.
Do not hardcode credentials in SQL scripts stored in version control. Where possible, use a RAM role attached to the PolarDB instance to grant OSS access without embedding an access key and secret.
To verify the import, query the raster metadata:
SELECT ST_Name(rast), ST_Width(rast), ST_Height(rast), ST_SRID(rast), ST_NumBands(rast)
FROM landsat8;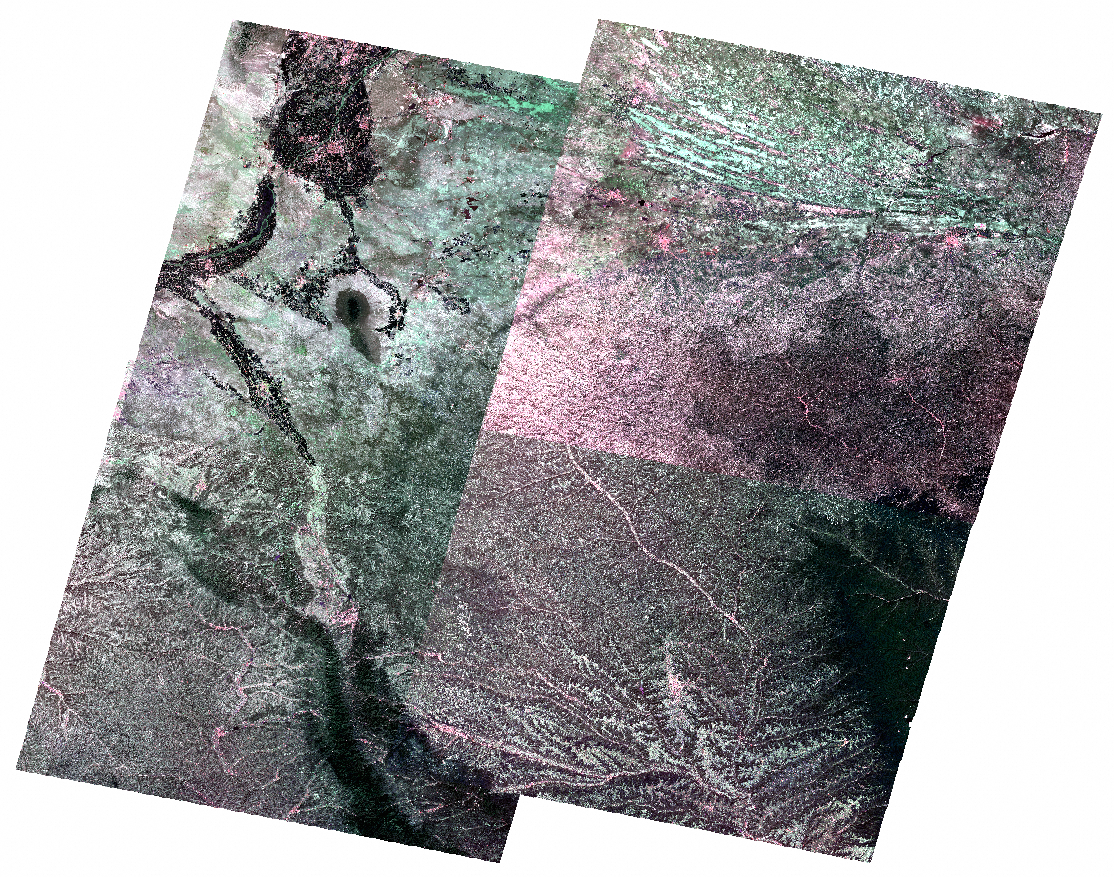
Mosaic and build pyramids
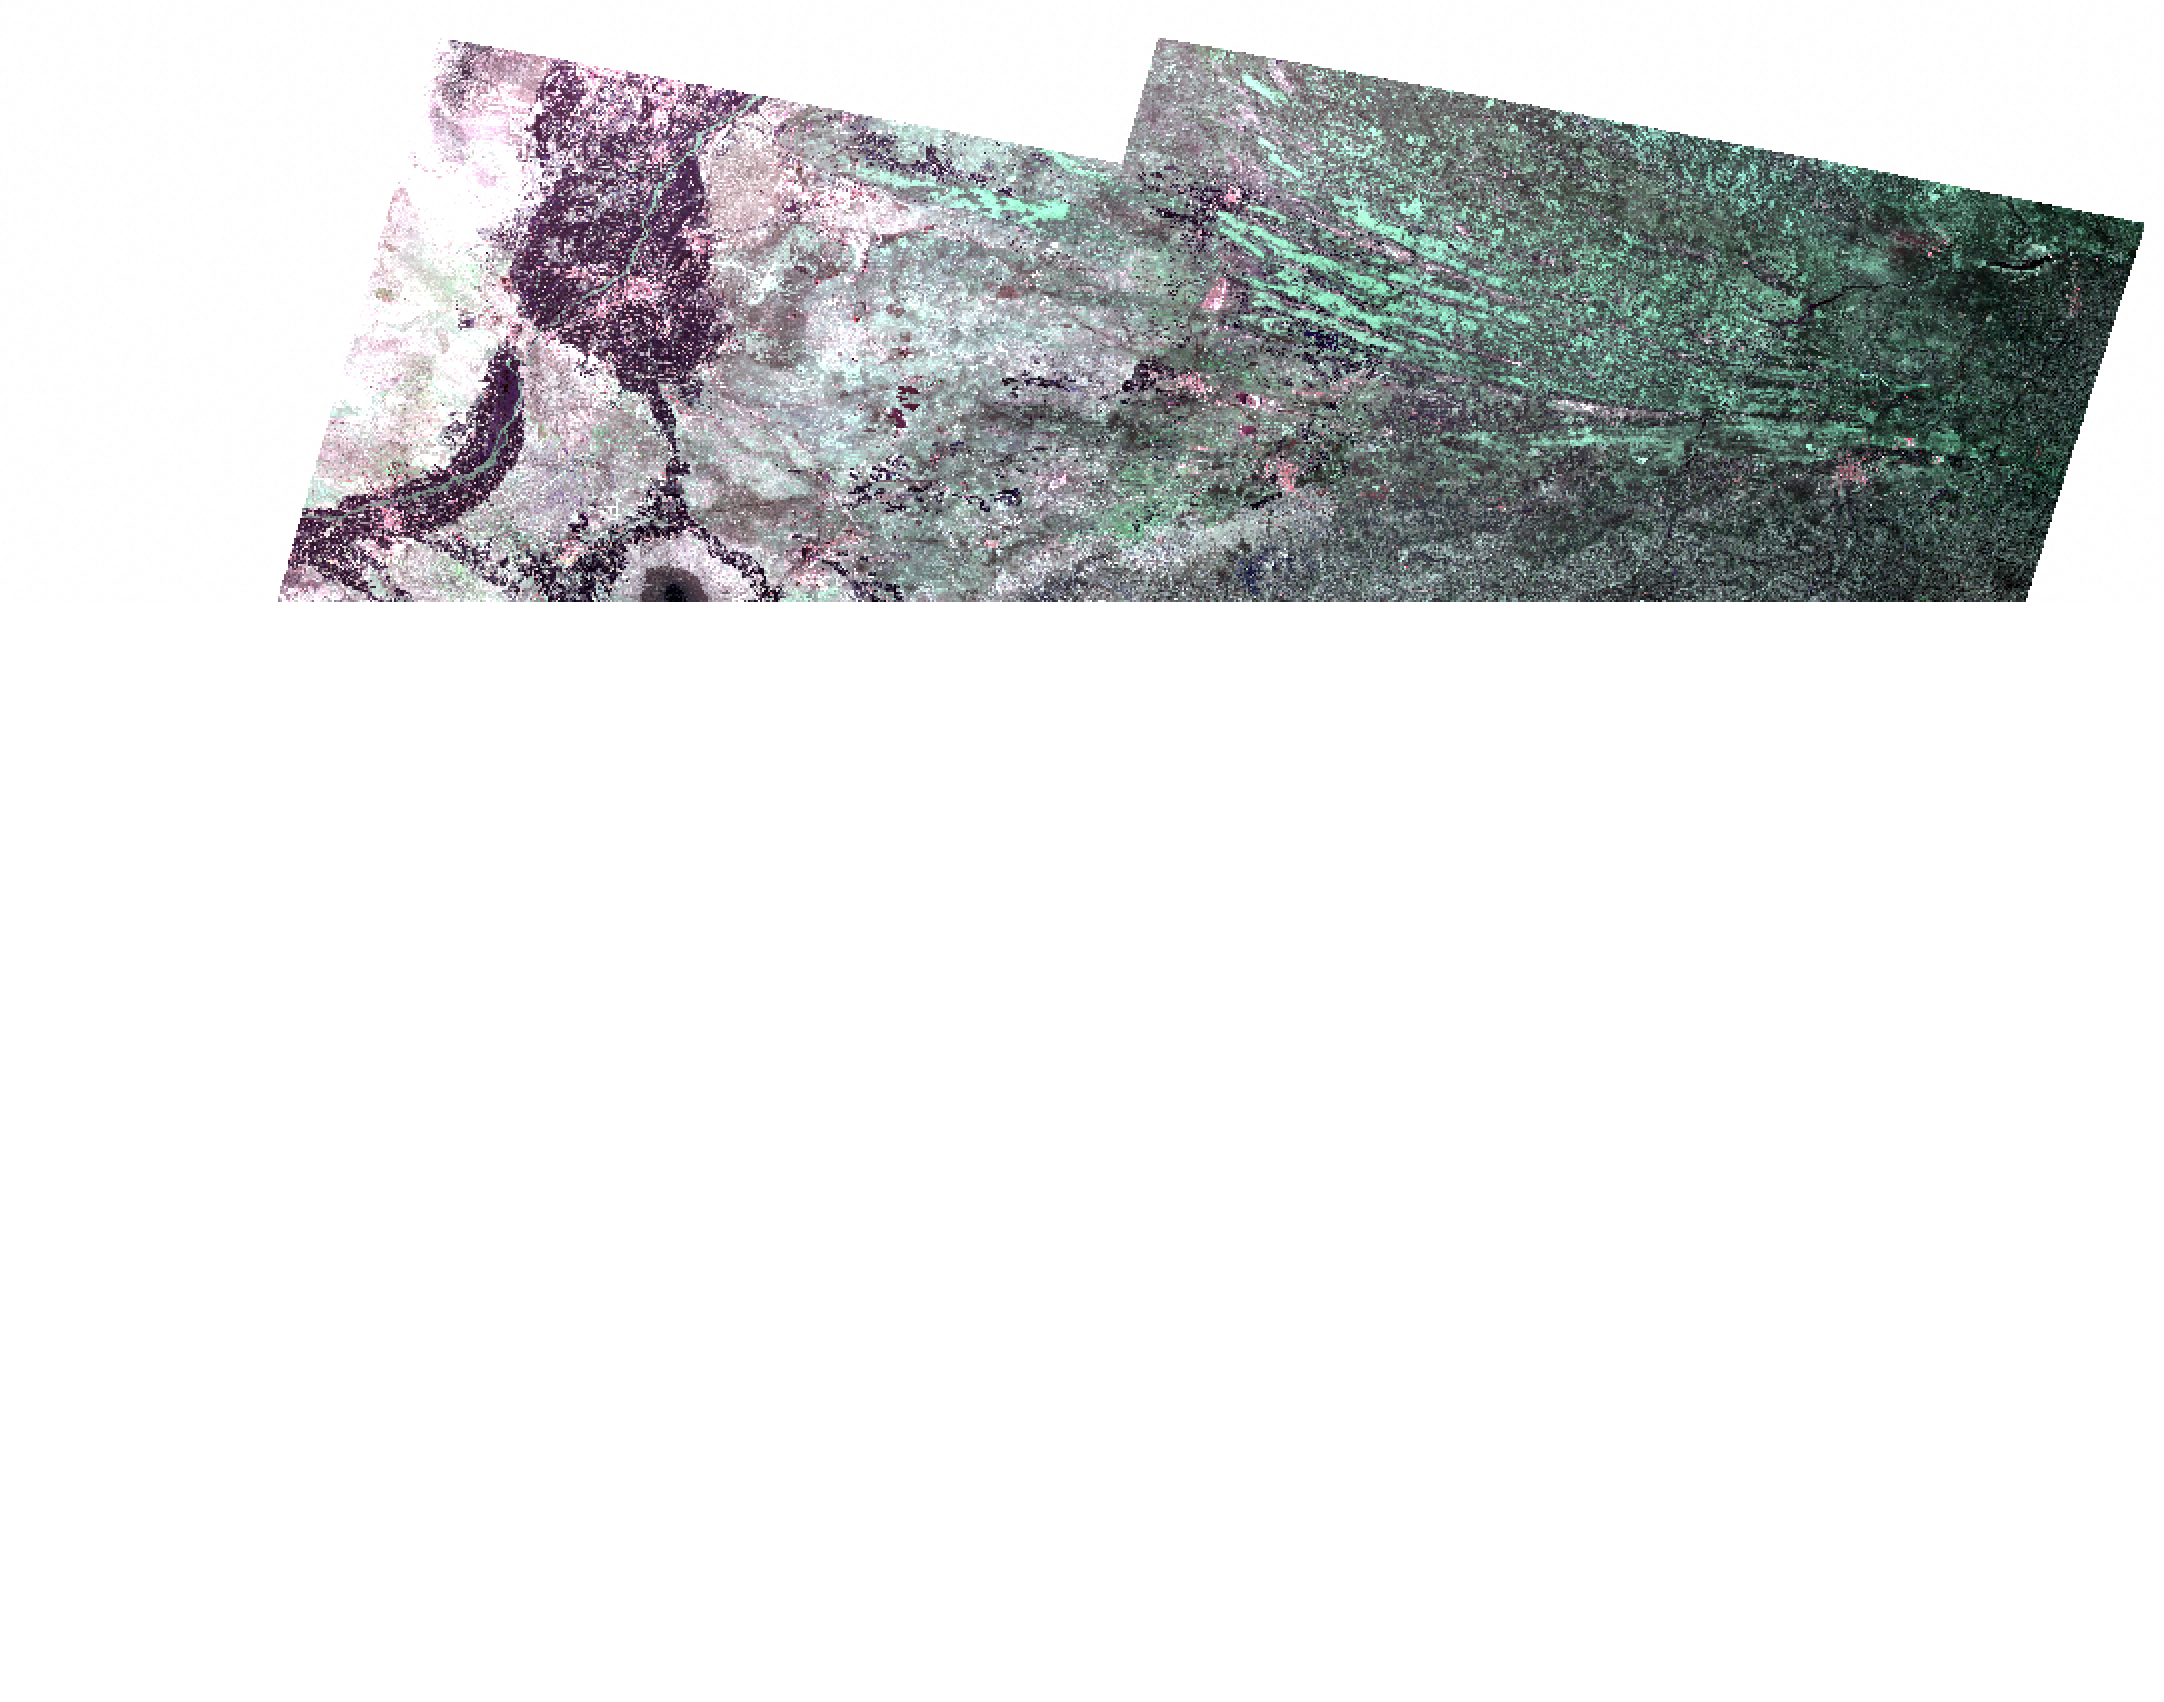
With four separate images loaded, mosaic them into a single virtual raster object (id 101) and enable color balancing for a seamless visual result:
-- Mosaic all four images with color balancing
INSERT INTO landsat8 VALUES (101, ST_MosaicFrom(
  Array(SELECT rast FROM landsat8 WHERE id < 5),
  'rbt_mosaic',
  '',
  '{"srid":4326, "cell_size":[0.0002,0.0002], "nodata":true, "nodatavalue":0, "color_balance":true}'
));
Then build pyramids on the mosaicked raster. Pyramids are downsampled overviews that accelerate rendering at different zoom levels:
-- Build pyramids for the mosaicked raster (id=101)
UPDATE landsat8 SET rast = ST_BuildPyramid(rast) WHERE id = 101;
After color balancing, the exported raster looks like this:
Step 2: Generate tiles with ST_AsTile
ST_AsTile takes a raster object and a tile envelope (defined by zoom level Z and tile coordinates X/Y) and returns a rendered image tile. ST_TileEnvelope converts a Z/X/Y tile address into the geographic bounding box that ST_AsTile needs.
The third argument to ST_AsTile is a JSON configuration object:
| Parameter | Description | Default |
|---|---|---|
format |
Output format: PNG, JPEG, or GTiff. Use GTiff to preserve raw pixel values. |
PNG |
bands |
Band indices mapped to RGB (for example, "0,1,2"). |
First three bands |
strength |
Display enhancement: none (no stretch), stats (statistical stretch), or ratio (percentage-based stretch). |
stats |
alpha |
Include an alpha channel for transparency. | — |
Example 1: Standard 3-band image
For a standard RGB image with no special stretching:
SELECT ST_AsTile(
  rast,
  ST_TileEnvelope(tile_zoom, tile_column, tile_row),
  '{"strength":"none", "format":"PNG", "alpha":true}'
)
FROM landsat8 WHERE id = 101;
Example 2: Multi-band image with contrast stretch
For multi-band imagery like Landsat, select specific bands and apply a percentage stretch to improve the visual output:
SELECT ST_AsTile(
  rast,
  ST_TileEnvelope(tile_zoom, tile_column, tile_row),
  '{"strength":"ratio", "format":"PNG", "bands":"0,1,2", "alpha":true}'
)
FROM landsat8 WHERE id = 101;
Here, bands 0, 1, and 2 map to R, G, and B channels, and the ratio method applies a percentage-based contrast stretch. The tile_zoom, tile_column, and tile_row values correspond directly to the {z}, {x}, and {y} path parameters in the HTTP tile URL served in Step 3.
Step 3: Build a tile server
This step creates a minimal Python web service that serves the tiles generated by your database. The service uses the Quart async web framework and asyncpg for non-blocking database access.
Install dependencies
pip install asyncpg quartCreate app.py
The service exposes two routes:
-
/— serves the HTML map page and calculates the initial map bounds from the raster extent. -
/raster/{z}/{x}/{y}— accepts a tile request, runsST_AsTilefor the given Z/X/Y coordinates, and returns the PNG tile.
from quart import Quart, send_file, render_template
import asyncpg
import io
import re

# Database connection parameters
CONNECTION = {
    "host": "<database-endpoint>",
    "port": "<port>",
    "user": "<username>",
    "password": "<password>",
    "database": "<database-name>"
}

TABLE_NAME = "landsat8"    # Target table
RASTER_COLUMN = "rast"     # Raster column name
RASTER_ID = "101"          # ID of the mosaicked raster

app = Quart(__name__, template_folder='./')


@app.before_serving
async def create_db_pool():
    app.db_pool = await asyncpg.create_pool(**CONNECTION)


@app.after_serving
async def close_db_pool():
    await app.db_pool.close()


@app.route("/")
async def home():
    sql = f'''
    SELECT ST_Extent(
      ST_Transform(
        ST_Envelope({RASTER_COLUMN}), 4326))
    FROM {TABLE_NAME}
    WHERE ID = {RASTER_ID};
    '''
    async with app.db_pool.acquire() as connection:
        box = await connection.fetchval(sql)
        box = re.findall(r'BOX\((.*?) (.*?),(.*?) (.*?)\)', box)[0]
        min_x, min_y, max_x, max_y = list(map(float, box))
        bounds = [[min_x, min_y], [max_x, max_y]]
        center = [(min_x + max_x) / 2, (min_y + max_y) / 2]
        return await render_template('./index.jinja2', center=str(center), bounds=str(bounds))


@app.route("/raster/<int:z>/<int:x>/<int:y>")
async def raster(z, x, y):
    # Select bands 0,1,2 as RGB with percentage-based contrast stretch
    config = '{"strength":"ratio","bands":"0,1,2","alpha":true}'
    sql = f'''
    SELECT (
      ST_AsTile({RASTER_COLUMN},
        ST_Transform(
          ST_TileEnvelope($1, $2, $3),
          ST_Srid({RASTER_COLUMN})),
        \'{config}\')
      ).data AS tile
    FROM {TABLE_NAME}
    WHERE ID = {RASTER_ID};'''
    async with app.db_pool.acquire() as connection:
        tile = await connection.fetchval(sql, z, x, y)
        return await send_file(io.BytesIO(tile), mimetype='image/png')


if __name__ == "__main__":
    app.run(port=5500)  # Change the port if needed
Replace the CONNECTION values with your PolarDB endpoint, port, credentials, and database name.
Step 4: Create the map page
In the same directory as app.py, create index.jinja2 — an HTML file that loads MapLibre GL JS and points its raster tile source at the /raster/{z}/{x}/{y} endpoint from Step 3.
Run the application
Start the tile server:
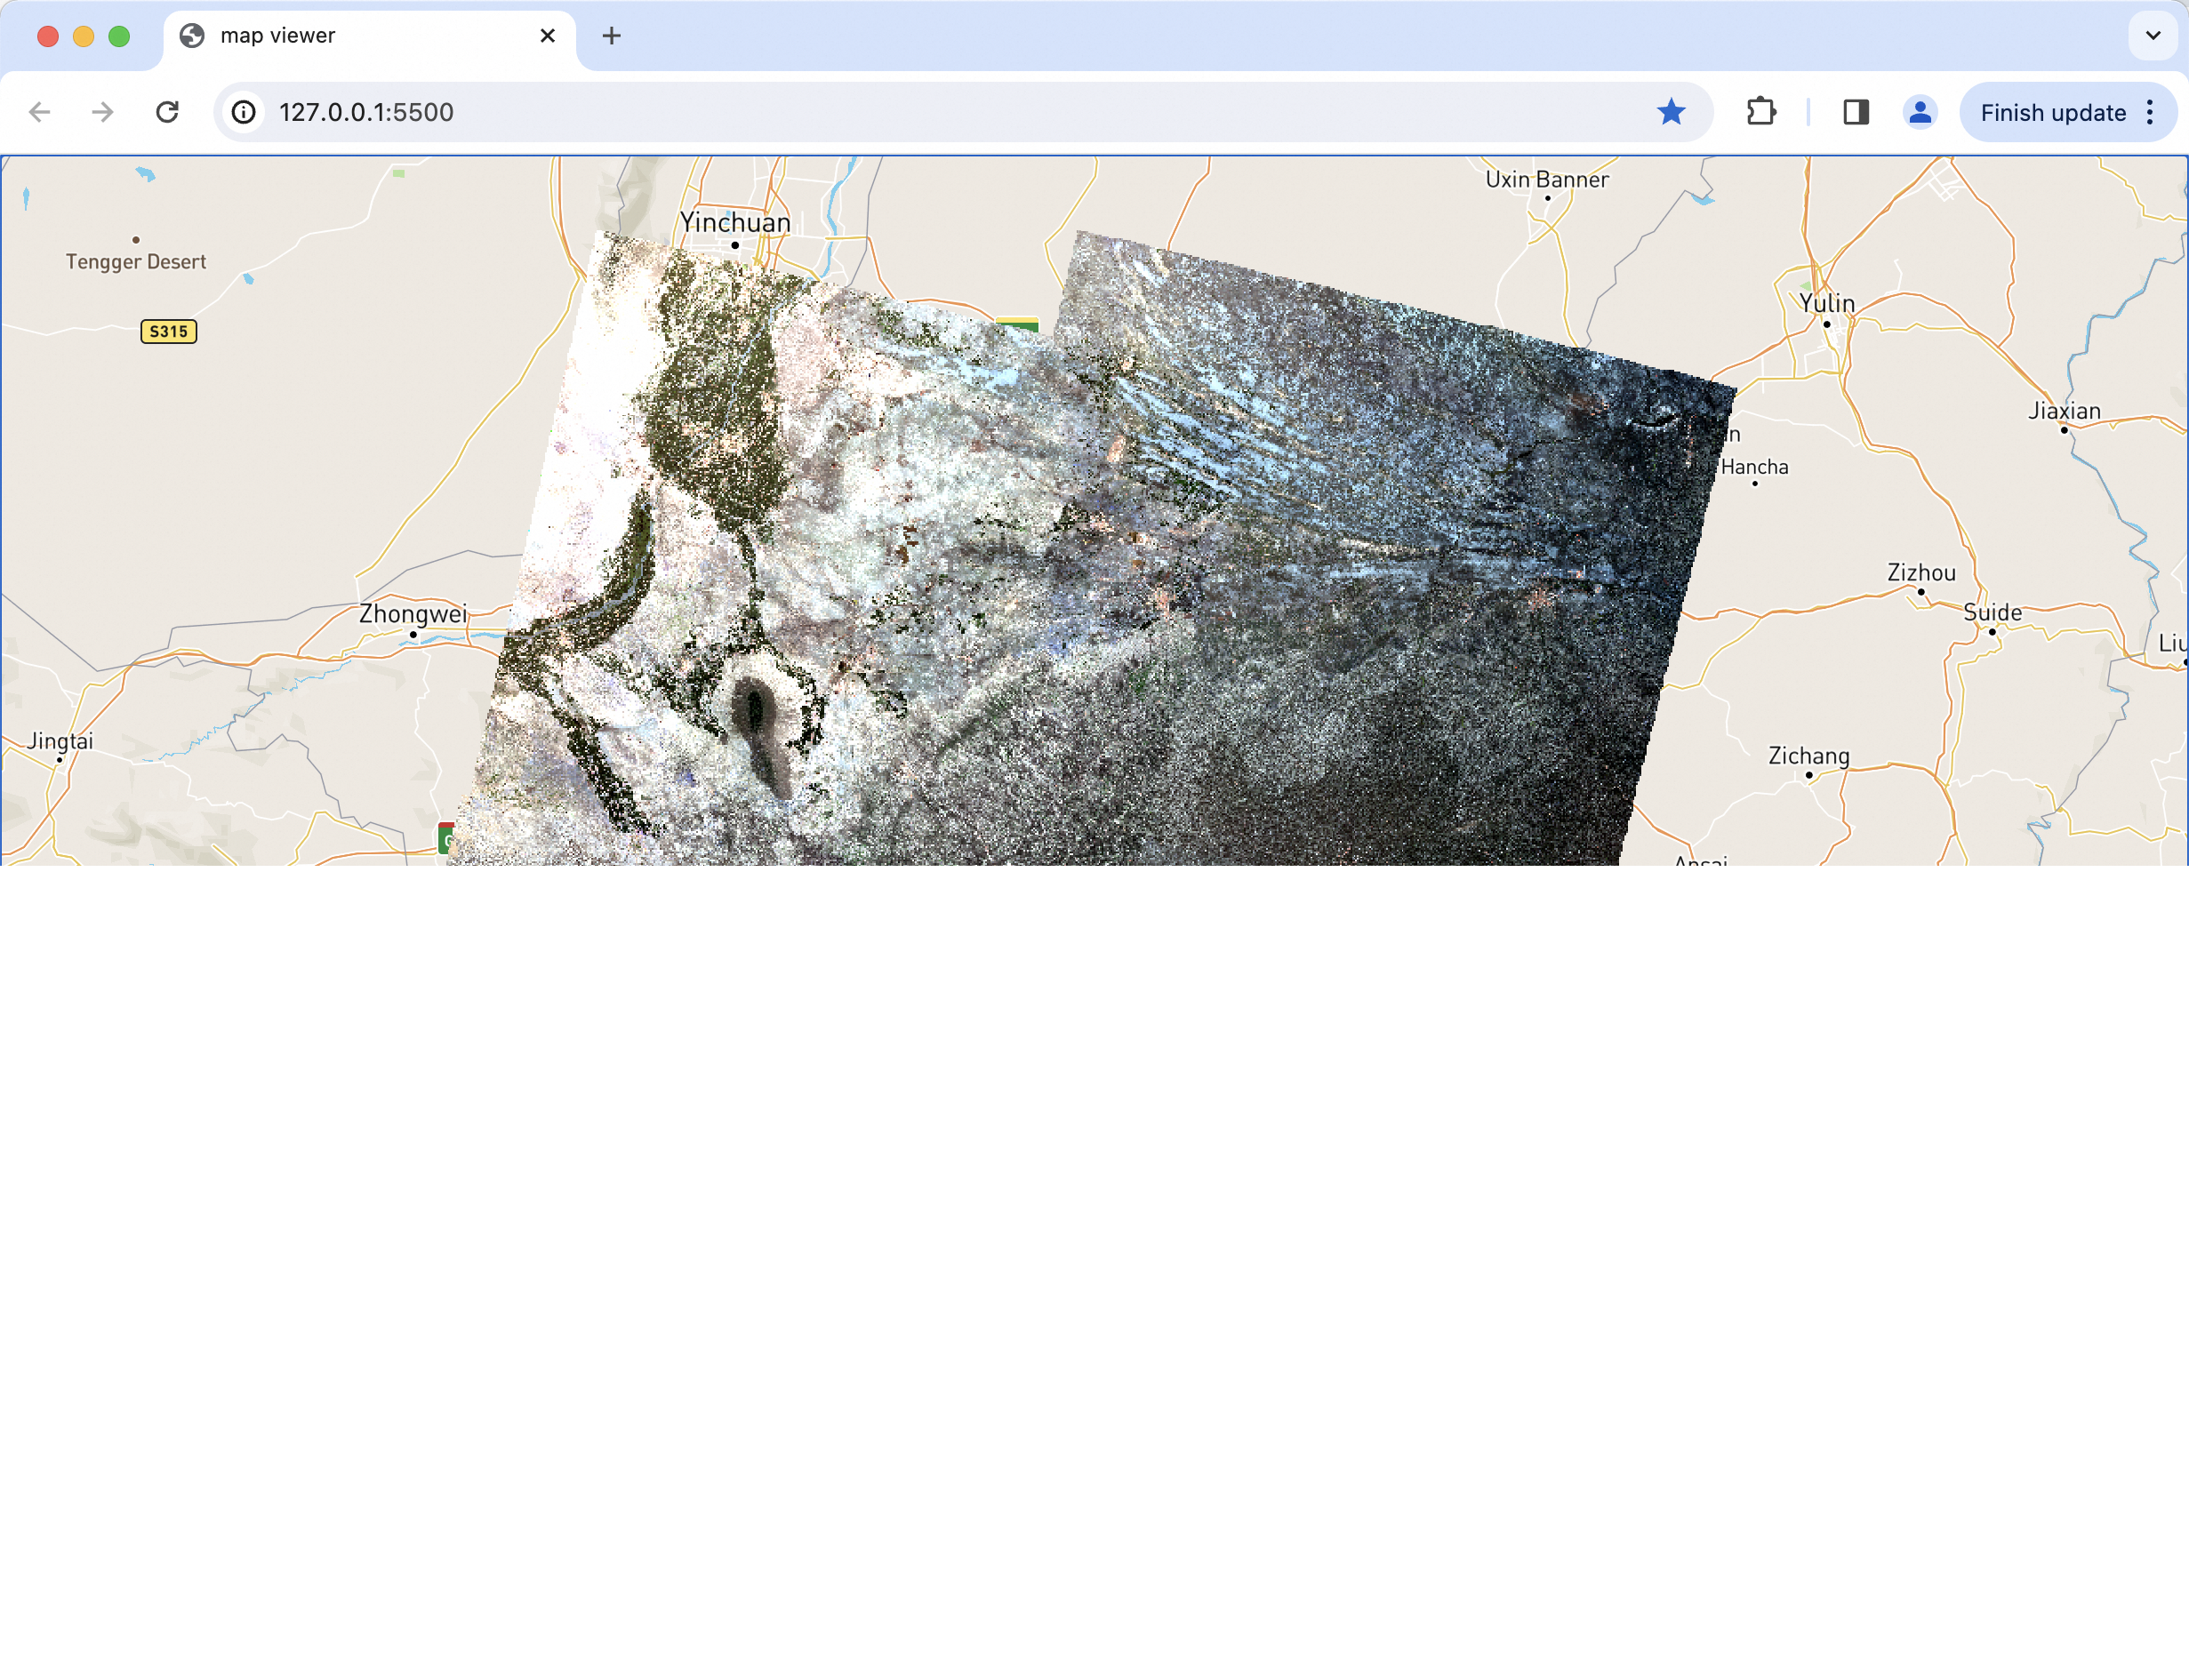
python app.pyOpen http://127.0.0.1:5500 in your browser. The map displays your Landsat satellite imagery with all tiles generated in real time from PolarDB.
See also
-
Low-code implementation of slice-free remote sensing image browsing (1): Pyramid — the pyramid-based alternative for raster visualization
-
ST_AsTile function reference — full parameter documentation
-
Raster model — background on how GanosBase stores and manages raster data
-
PolarDB free trial — select Cloud Native Database PolarDB for PostgreSQL to try GanosBase