The pldebugger extension lets you debug functions and stored procedures written in PL/pgSQL, PL/Python, PL/Perl, PL/Tcl, and PL/Java directly in pgAdmin 4.
Prerequisites
Before you begin, make sure you have:
pgAdmin 4 v4.19 or later. Download from pgAdmin 4
A PolarDB cluster that you can connect to. See
Connection limits
Each PolarDB cluster allows up to three simultaneous pldebugger connections by default. Because each debugging session uses two connections, this default supports up to three concurrent debugging sessions.
If you need more than three connections, go to Quota Center and click Apply in the Actions column for PolarDB PG pldebugger plug-in use.
If you have reached the limit and need to start a new session, close one of the existing sessions first.
Enable the pldebugger extension
Run the following command as the polar_superuser user:
postgres=# CREATE EXTENSION if not exists pldbgapi;
CREATE EXTENSION
Debug a function
Open pgAdmin 4 and connect to your PolarDB cluster.
In the object tree, find the function to debug. Right-click the function and choose Debugging > Debug.
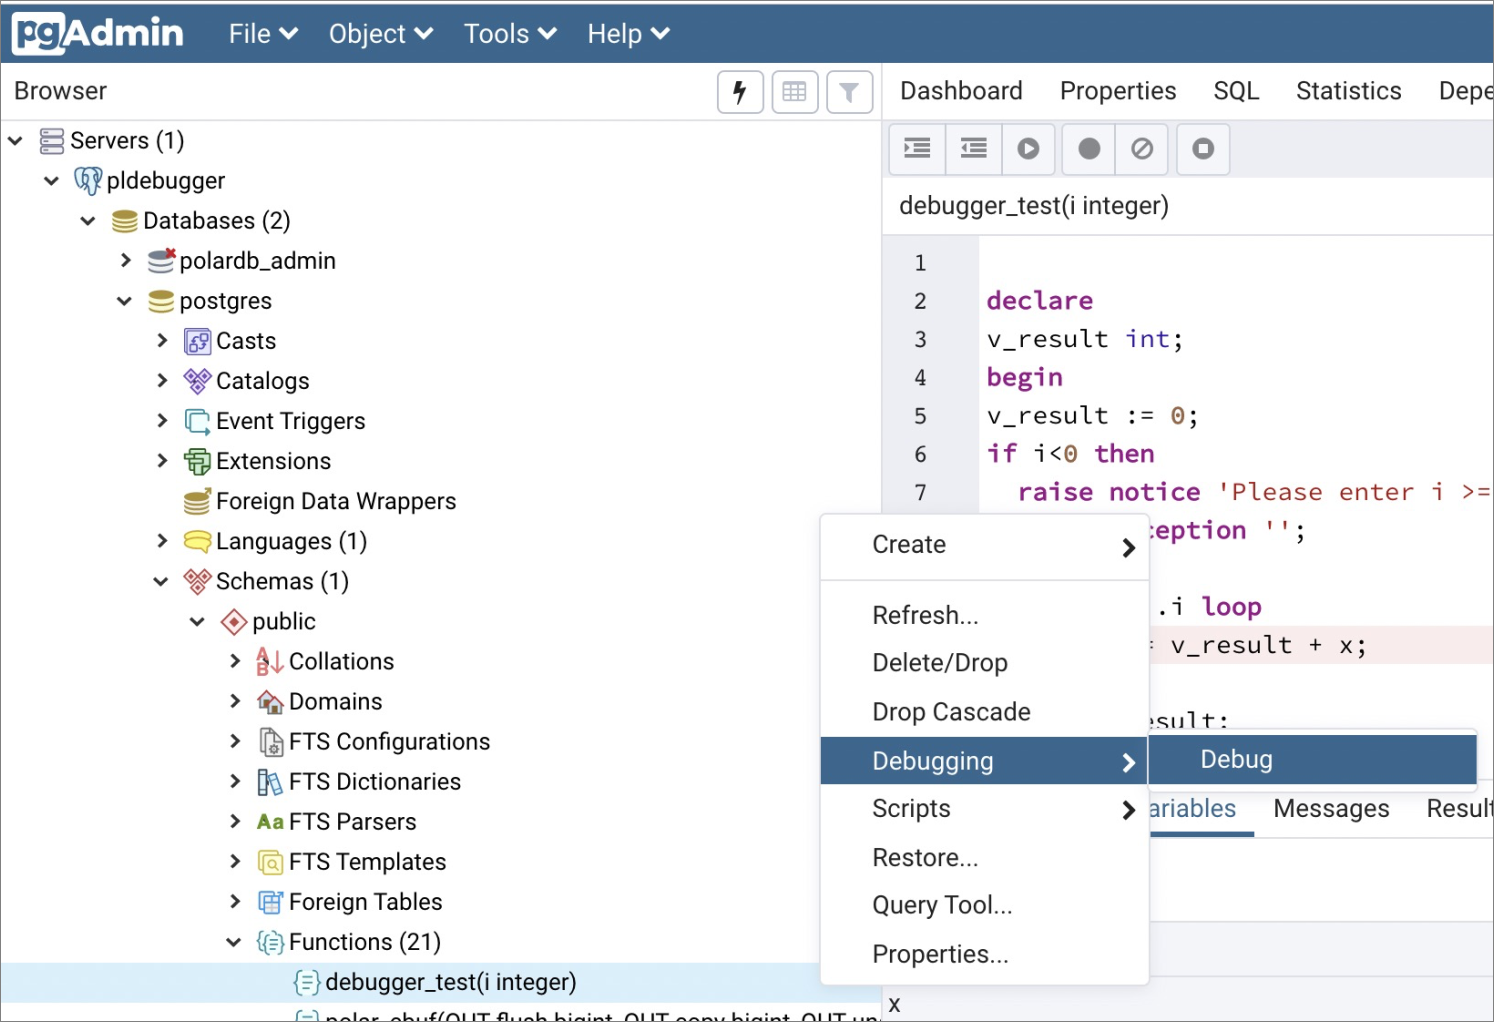
The pldebugger interface opens on the right side of the pgAdmin 4 page.
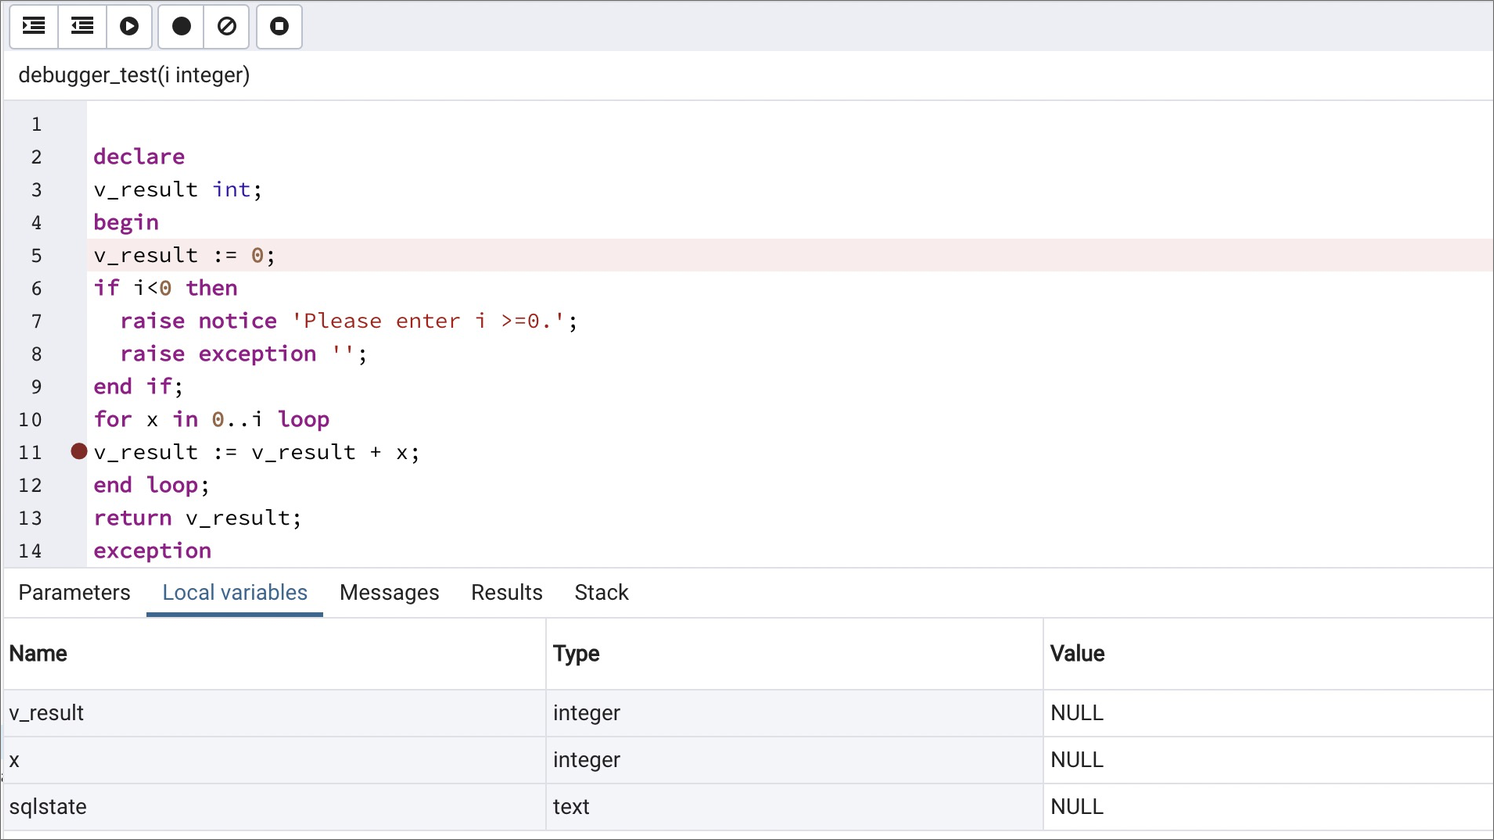
Toolbar actions — Use the toolbar on the right panel to control execution:
| Action | Description |
|---|---|
| Step into | Execute the current line. If the line calls a sub-function, step into that function. |
| Step over | Execute the current line. If the line calls a sub-function, the sub-function runs without being debugged. |
| Continue | Resume execution until the next breakpoint or until the function completes. |
| Set breakpoint | Pause execution at a specific line each time it is reached. |
| Stop | Halt execution immediately. |
Bottom panel tabs — View runtime information during the debugging session:
| Tab | Shows |
|---|---|
| Local variables | Values of variables declared in the function |
| Results | Return values from the function |
| Stack | The call stack at the current point of execution |
Monitor pldebugger connections
Use polar_monitor_pldebugger_count() to check how many connections are currently active:
postgres=# select * from polar_monitor_pldebugger_count();
 current_connection | max_connection
--------------------+----------------
                  6 |              6
(1 row)| Column | Description |
|---|---|
current_connection | Number of active connections to pldebugger |
max_connection | Maximum number of connections allowed |
In the example above, current_connection is 6. Because each debugging session uses two connections, this means three debugging sessions are currently running — the default maximum.