Storage analysis is part of Quick Diagnostics in PolarDB for PostgreSQL (Compatible with Oracle). It integrates functionality from Database Autonomy Service (DAS) to show how your cluster is using storage, identify which databases and tables consume the most space, and estimate when storage will be exhausted.
With storage analysis, you can:
Check total storage used, free space, and how many days remain before storage is exhausted
Spot usage trends over time to anticipate when to scale
Identify which databases and tables consume the most space
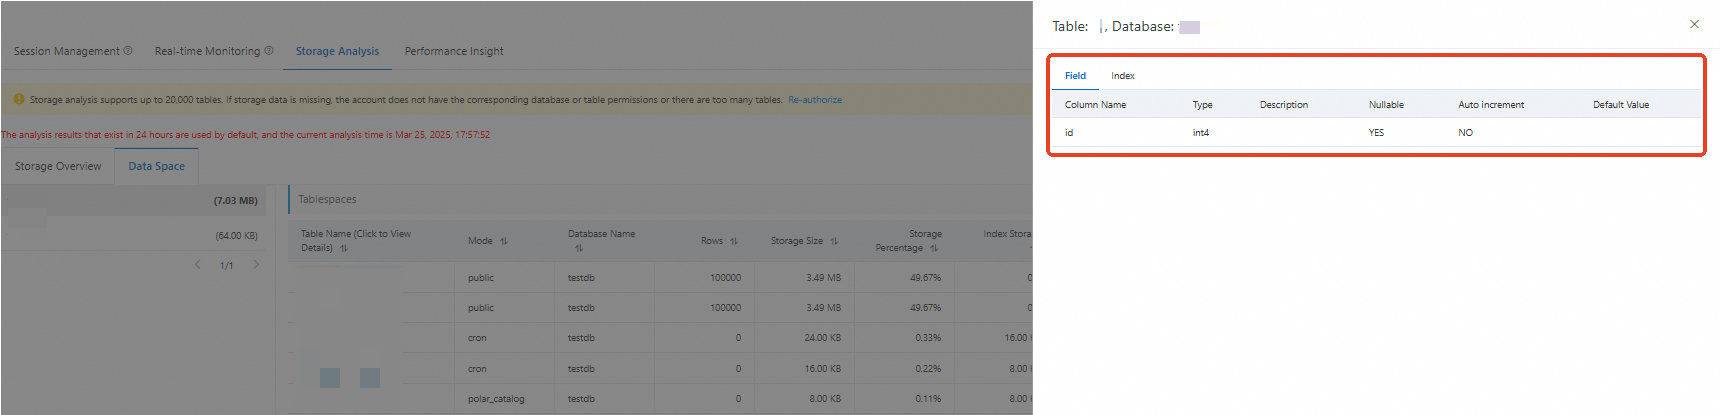
Drill into individual tables to inspect field and index sizes
Storage views
Storage analysis presents two complementary views of your cluster's storage:
| View | What it shows |
|---|---|
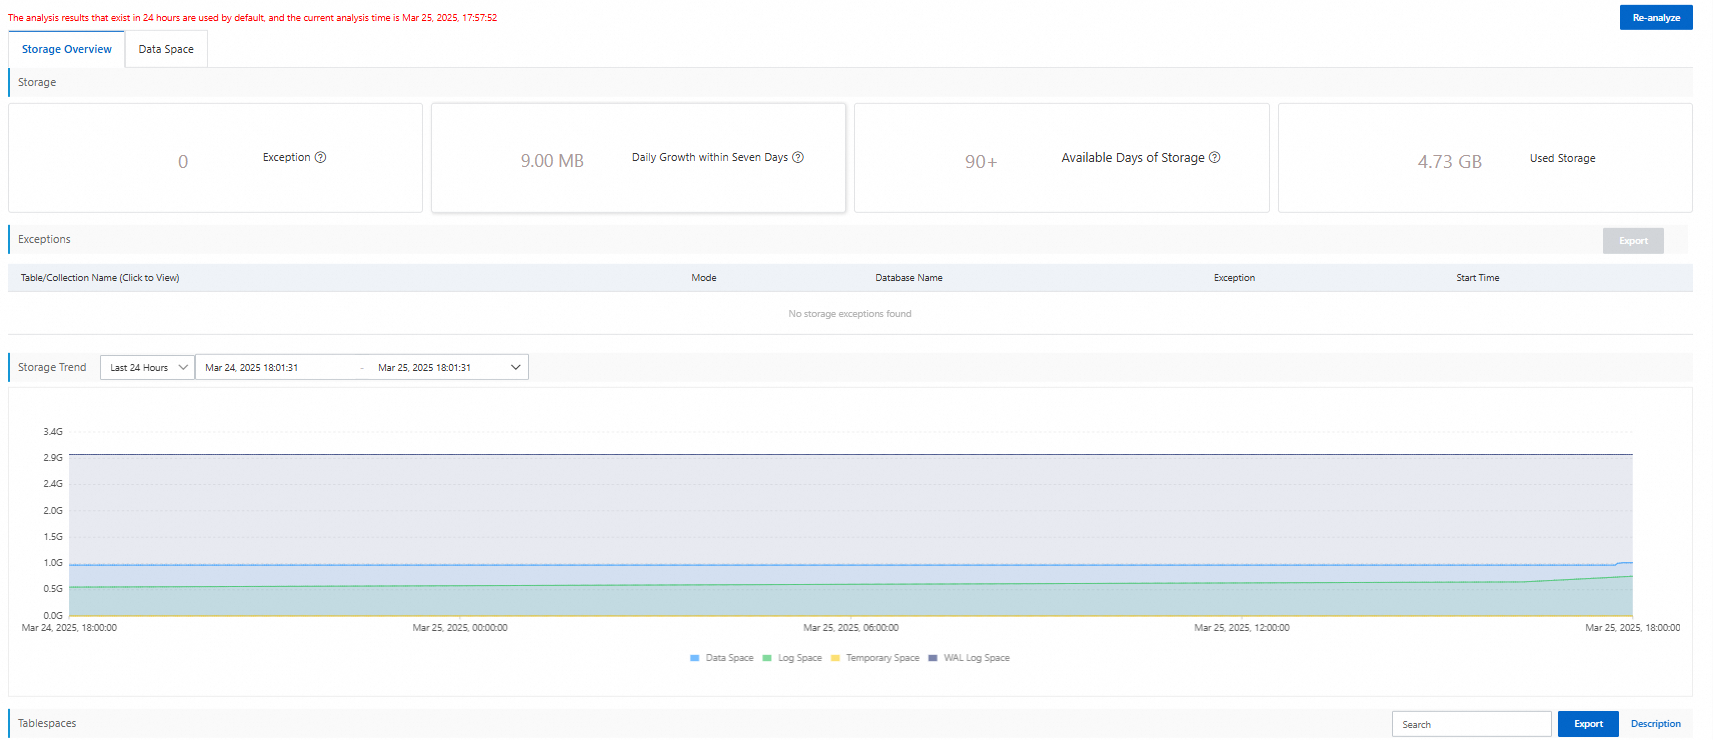
| Storage Overview | Cluster-level metrics: total capacity, current usage, remaining days, and usage trends over time |
| Data Space | Database- and table-level breakdown: storage consumed by each database and table, including data size, index size, and row count |
Use Storage Overview to assess overall health and plan capacity. Use Data Space to locate the databases or tables driving the most storage consumption.
Limits
Storage analysis can analyze up to 20,000 tables.
Prerequisites
Before you begin, ensure that you have:
A running PolarDB for PostgreSQL (Compatible with Oracle) cluster
Access to the PolarDB console
View storage usage
Log on to the PolarDB console, select the region where your cluster is deployed, and click the cluster ID in the Clusters list to go to the basic information page.
In the left-side navigation pane, choose Diagnostics and Optimization > Quick Diagnostics.
Click the Storage Analysis tab.
View the information you need:
Storage Overview — shows overall cluster storage status and usage trends. Click the Storage Overview tab to see the overall status and usage trends of the cluster storage, and estimated remaining days before storage is exhausted. Use this view to decide whether to scale storage.
Data Space — shows storage consumption at the database and table level. Click the Data Space tab to see the storage usage of each individual database and individual table. Click a table name to inspect its individual fields and indexes.
What's next
If Storage Overview shows a low remaining-days estimate, scale up your cluster storage before the space is exhausted.
If Data Space reveals a table consuming unexpectedly large storage, inspect its indexes for bloat.