Automatic Workload Repository (AWR) collects and analyzes performance statistics from database dynamic views to generate performance reports for a specified time range. The global AWR feature of PolarDB for PostgreSQL (Compatible with Oracle) extends this capability beyond the primary node to cover all primary and read-only nodes in a cluster, giving you a unified view of cluster-wide performance.
With global AWR, you can:
Analyze database resources, top SQL statements, top tables, and top indexes across all nodes
Collect performance data and event information down to the second for precise root cause analysis
View performance trends and identify the root cause of performance jitters using Grafana dashboards
How it works

Global AWR uses a three-layer architecture:
| Layer | Component | Function |
|---|---|---|
| Collection | UE (proxy process on physical machines) | Collects performance data and event information from the PolarDB cluster |
| Storage | Cluster local storage | Stores collected data; you configure whether to write data back to the cluster |
| Presentation | Grafana dashboards | Displays trend charts and reports; requires a configured data source and imported dashboard file |
What you can monitor
Global AWR surfaces cluster performance through three analysis dimensions. Use them together to move from "overall load" to "specific bottleneck."
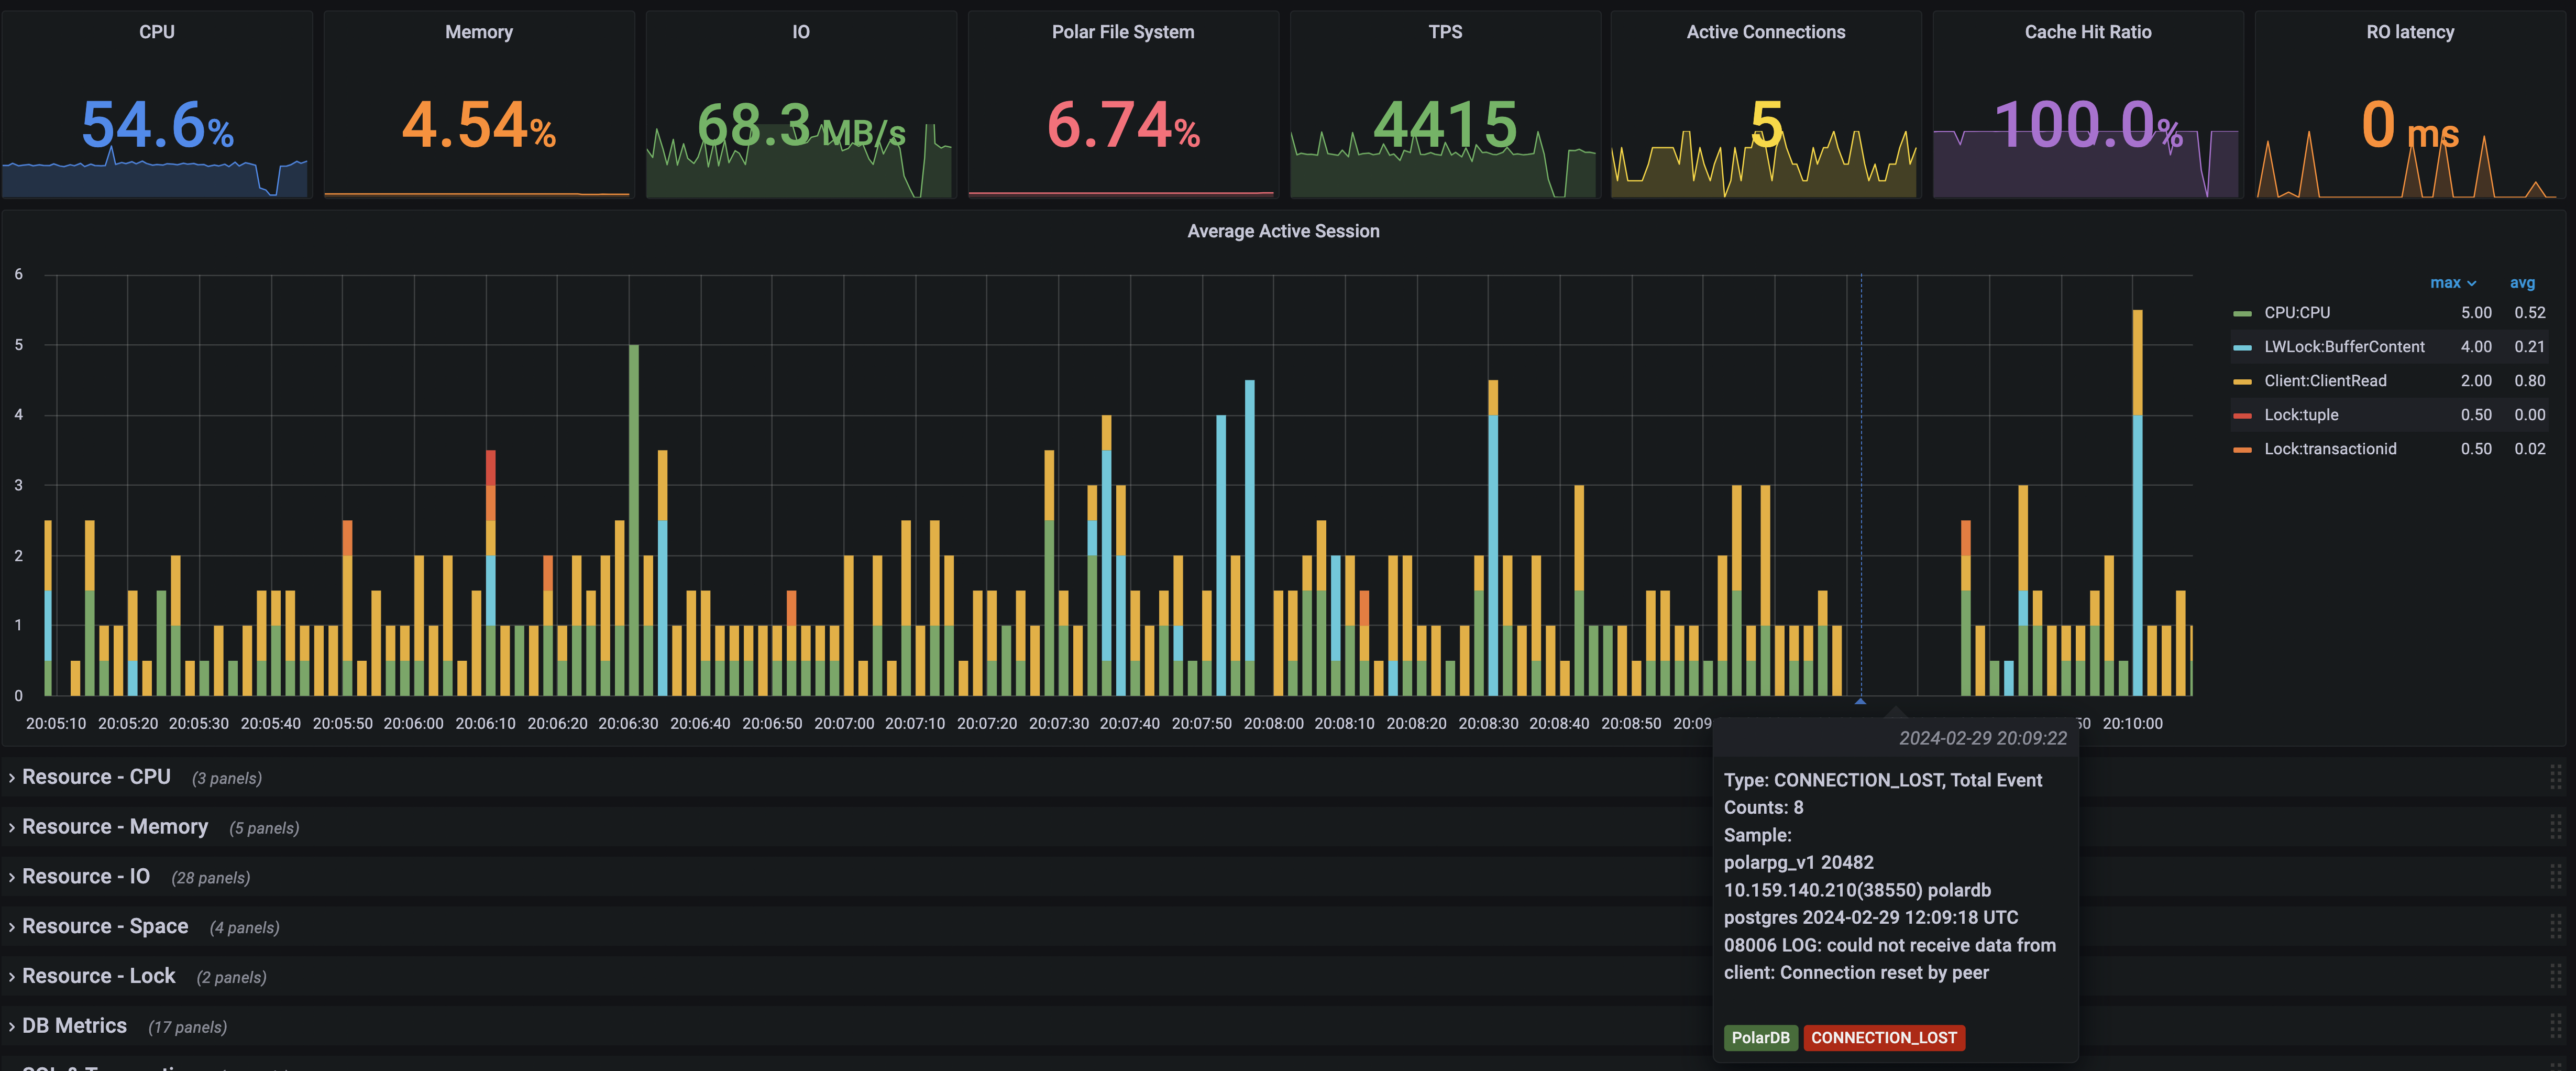
Average Active Sessions (AAS) trend
AAS is the primary indicator for diagnosing performance issues. It measures how many sessions are concurrently active on the database at any given moment. Use this chart together with resource consumption data to identify performance bottlenecks. The chart also captures discrete events: the following figure shows a disconnection at 20:09:22.
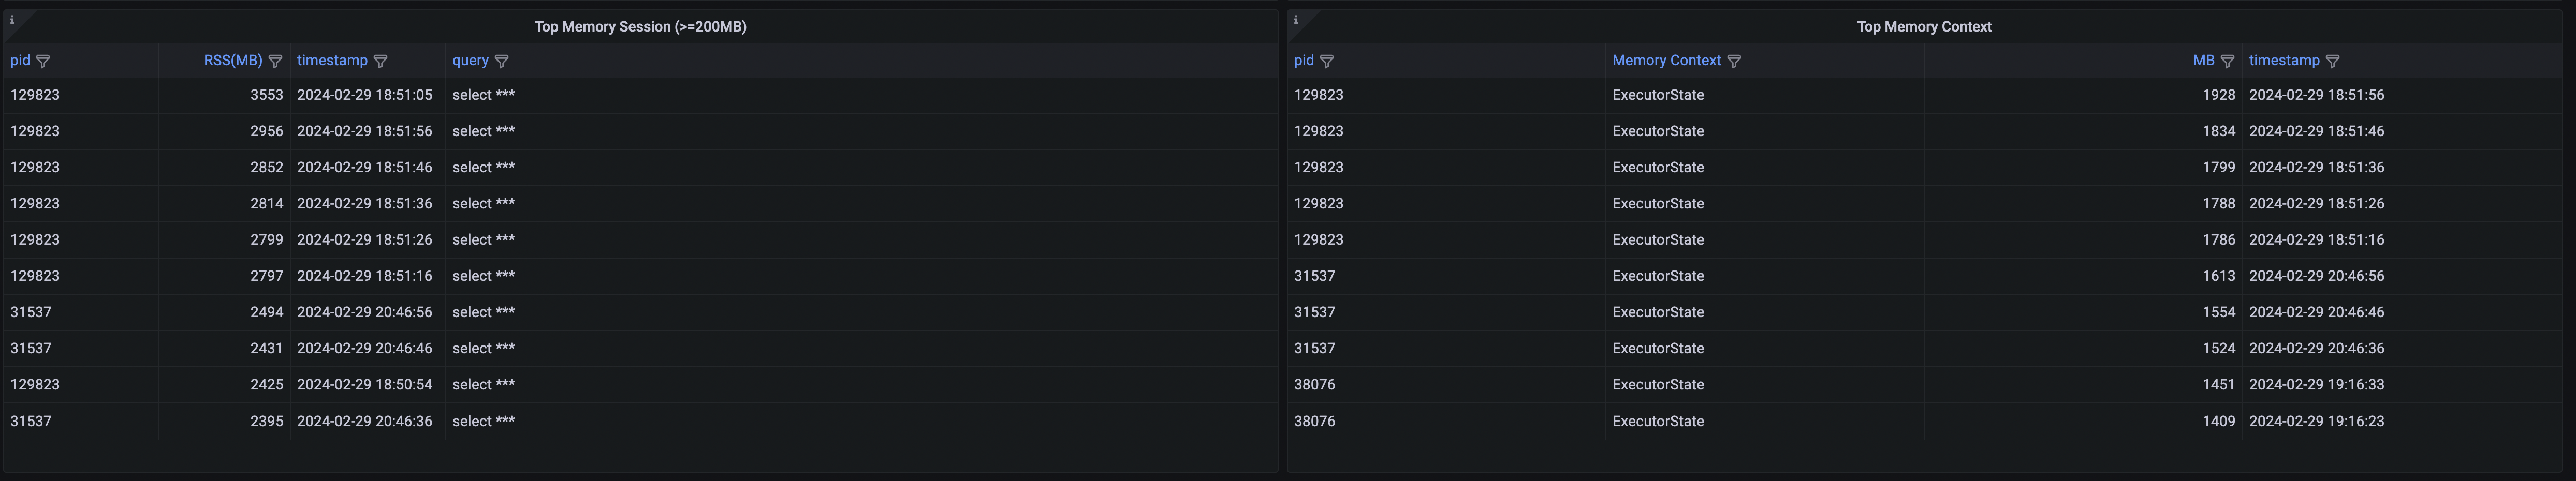
SQL memory analysis
Drill into individual SQL statements to view their memory usage and memory context.
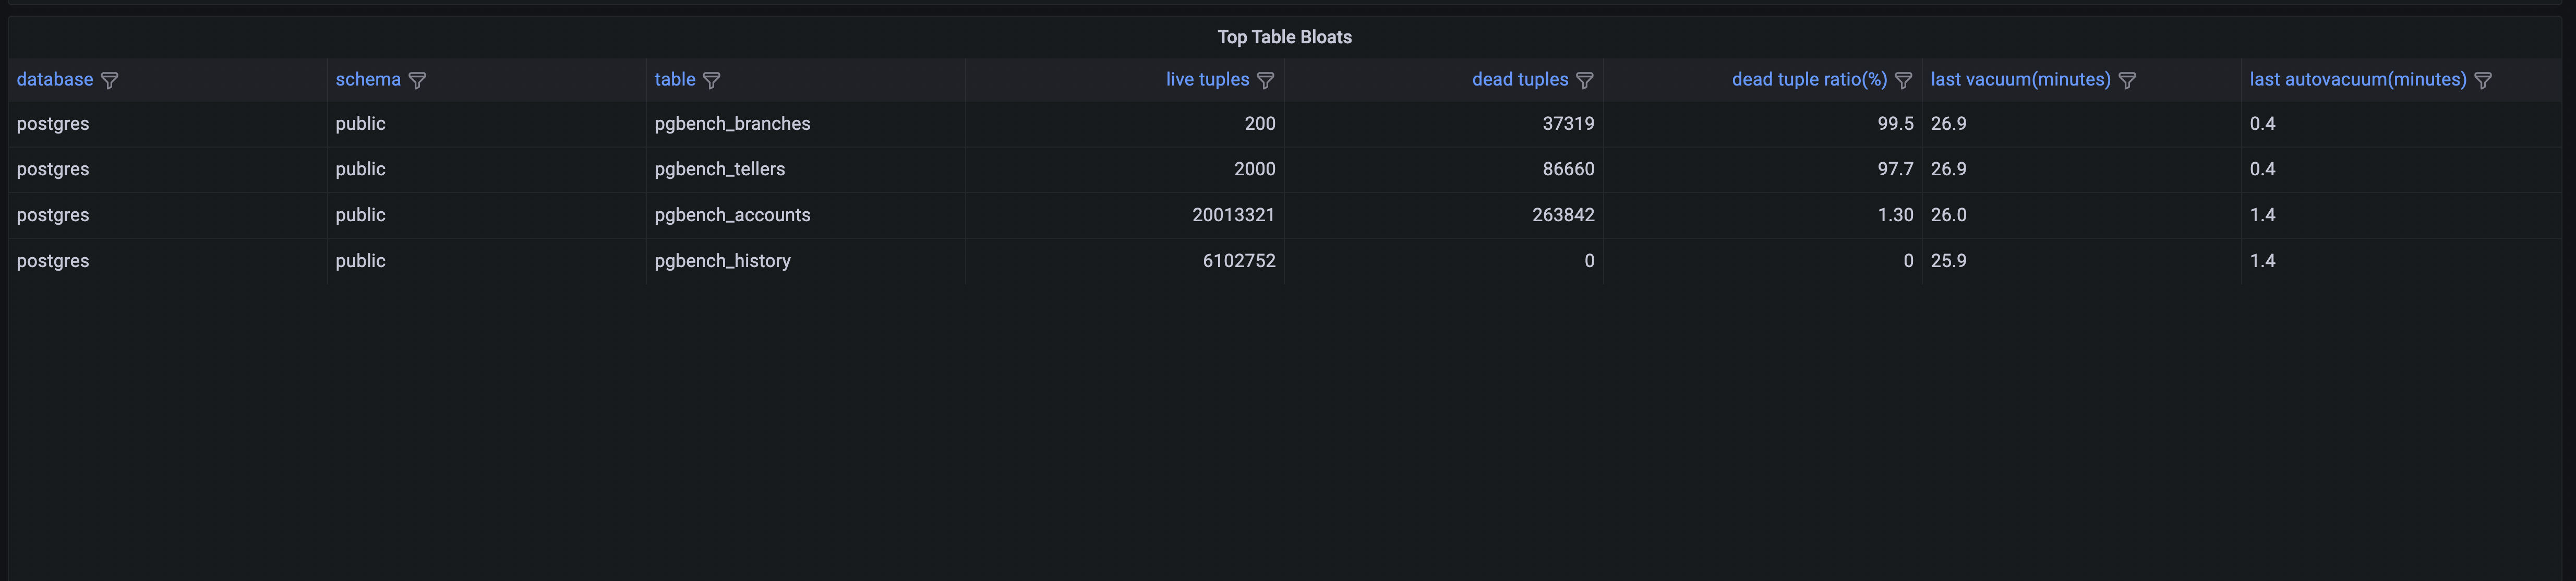
Top SQL statements and top tables
Identify the SQL statements and tables that consume the most resources across the cluster.
Prerequisites
| Requirement | Details |
|---|---|
| Kernel version | 20211231 or later |
| Permissions | Control and data permissions for global AWR are PUBLIC |
| Time zone | The cluster default is UTC; account for your local time difference when reading performance data |
To check your kernel version, run:
show polar_release_date;Expected output:
polar_release_date
--------------------
20211231
(1 row)
Enable local storage for global AWR data
Enabling local storage lets global AWR generate fine-grained performance reports without requiring periodic snapshot triggers.
Enabling global AWR incurs additional overheads. Evaluate the impact before enabling it in production:
Performance: Overall performance loss is within 10%.
Storage: Data is retained for three days by default. The most fine-grained data for three days must be less than 10 GB.
Run the following commands in the postgres database.Enable local storage
SELECT polar_gawr_collection.enable_store_in_localdb();Expected output:
enable_store_in_localdb
-------------------------

(1 row)
Disable local storage
SELECT polar_gawr_collection.disable_store_in_localdb();Expected output:
disable_store_in_localdb
--------------------------

(1 row)
Check whether local storage is enabled
SELECT polar_gawr_collection.show_store_in_localdb();Expected output when enabled:
show_store_in_localdb
-----------------------
 t
(1 row)
After enabling local storage, view performance data in the polar_gawr_collection mode of the postgres database.
Configure Grafana to view AWR data
Download and install Grafana
Download Grafana from grafana.com/grafana/download. We recommend that you use Grafana 8.1.2 or later.
Add a data source
Add the PolarDB for PostgreSQL (Compatible with Oracle) cluster as a PostgreSQL data source in Grafana.
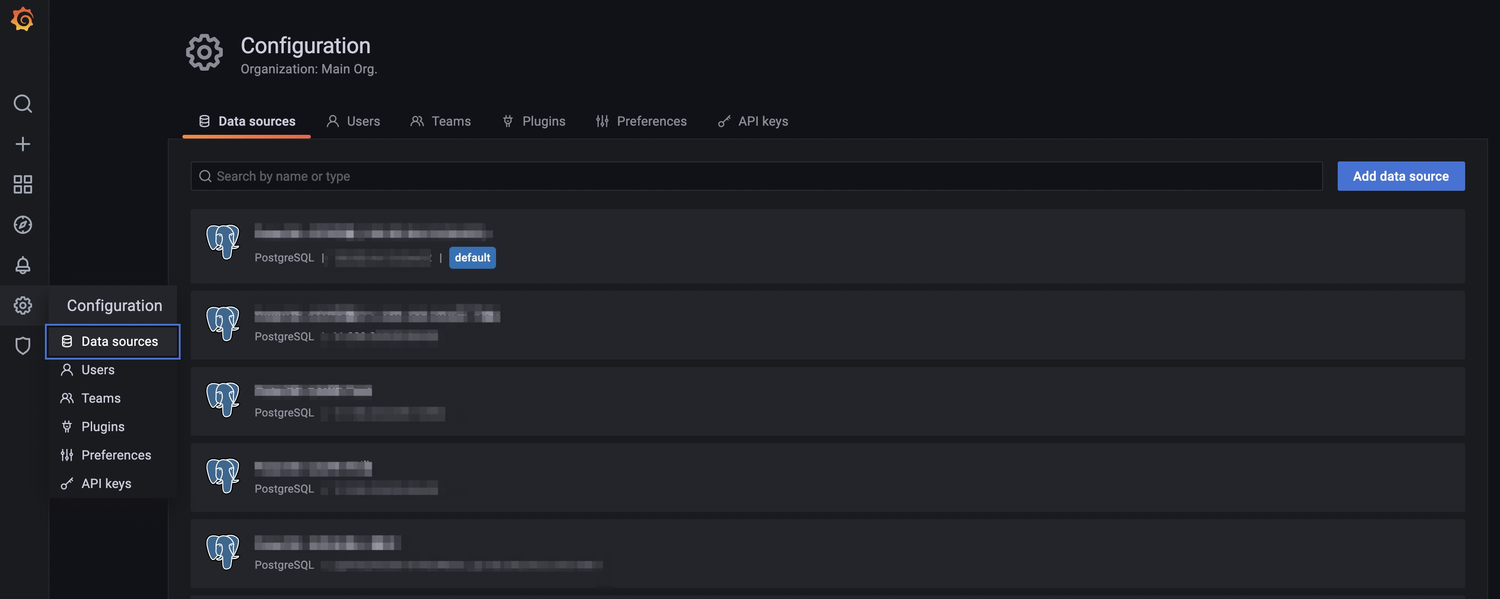
Start Grafana. In the left-side navigation pane, choose Configuration > Data sources.
On the Data sources tab, click Add data source in the upper-right corner.
Enter the connection information for your cluster.
In the
Databasefield, enterpostgres.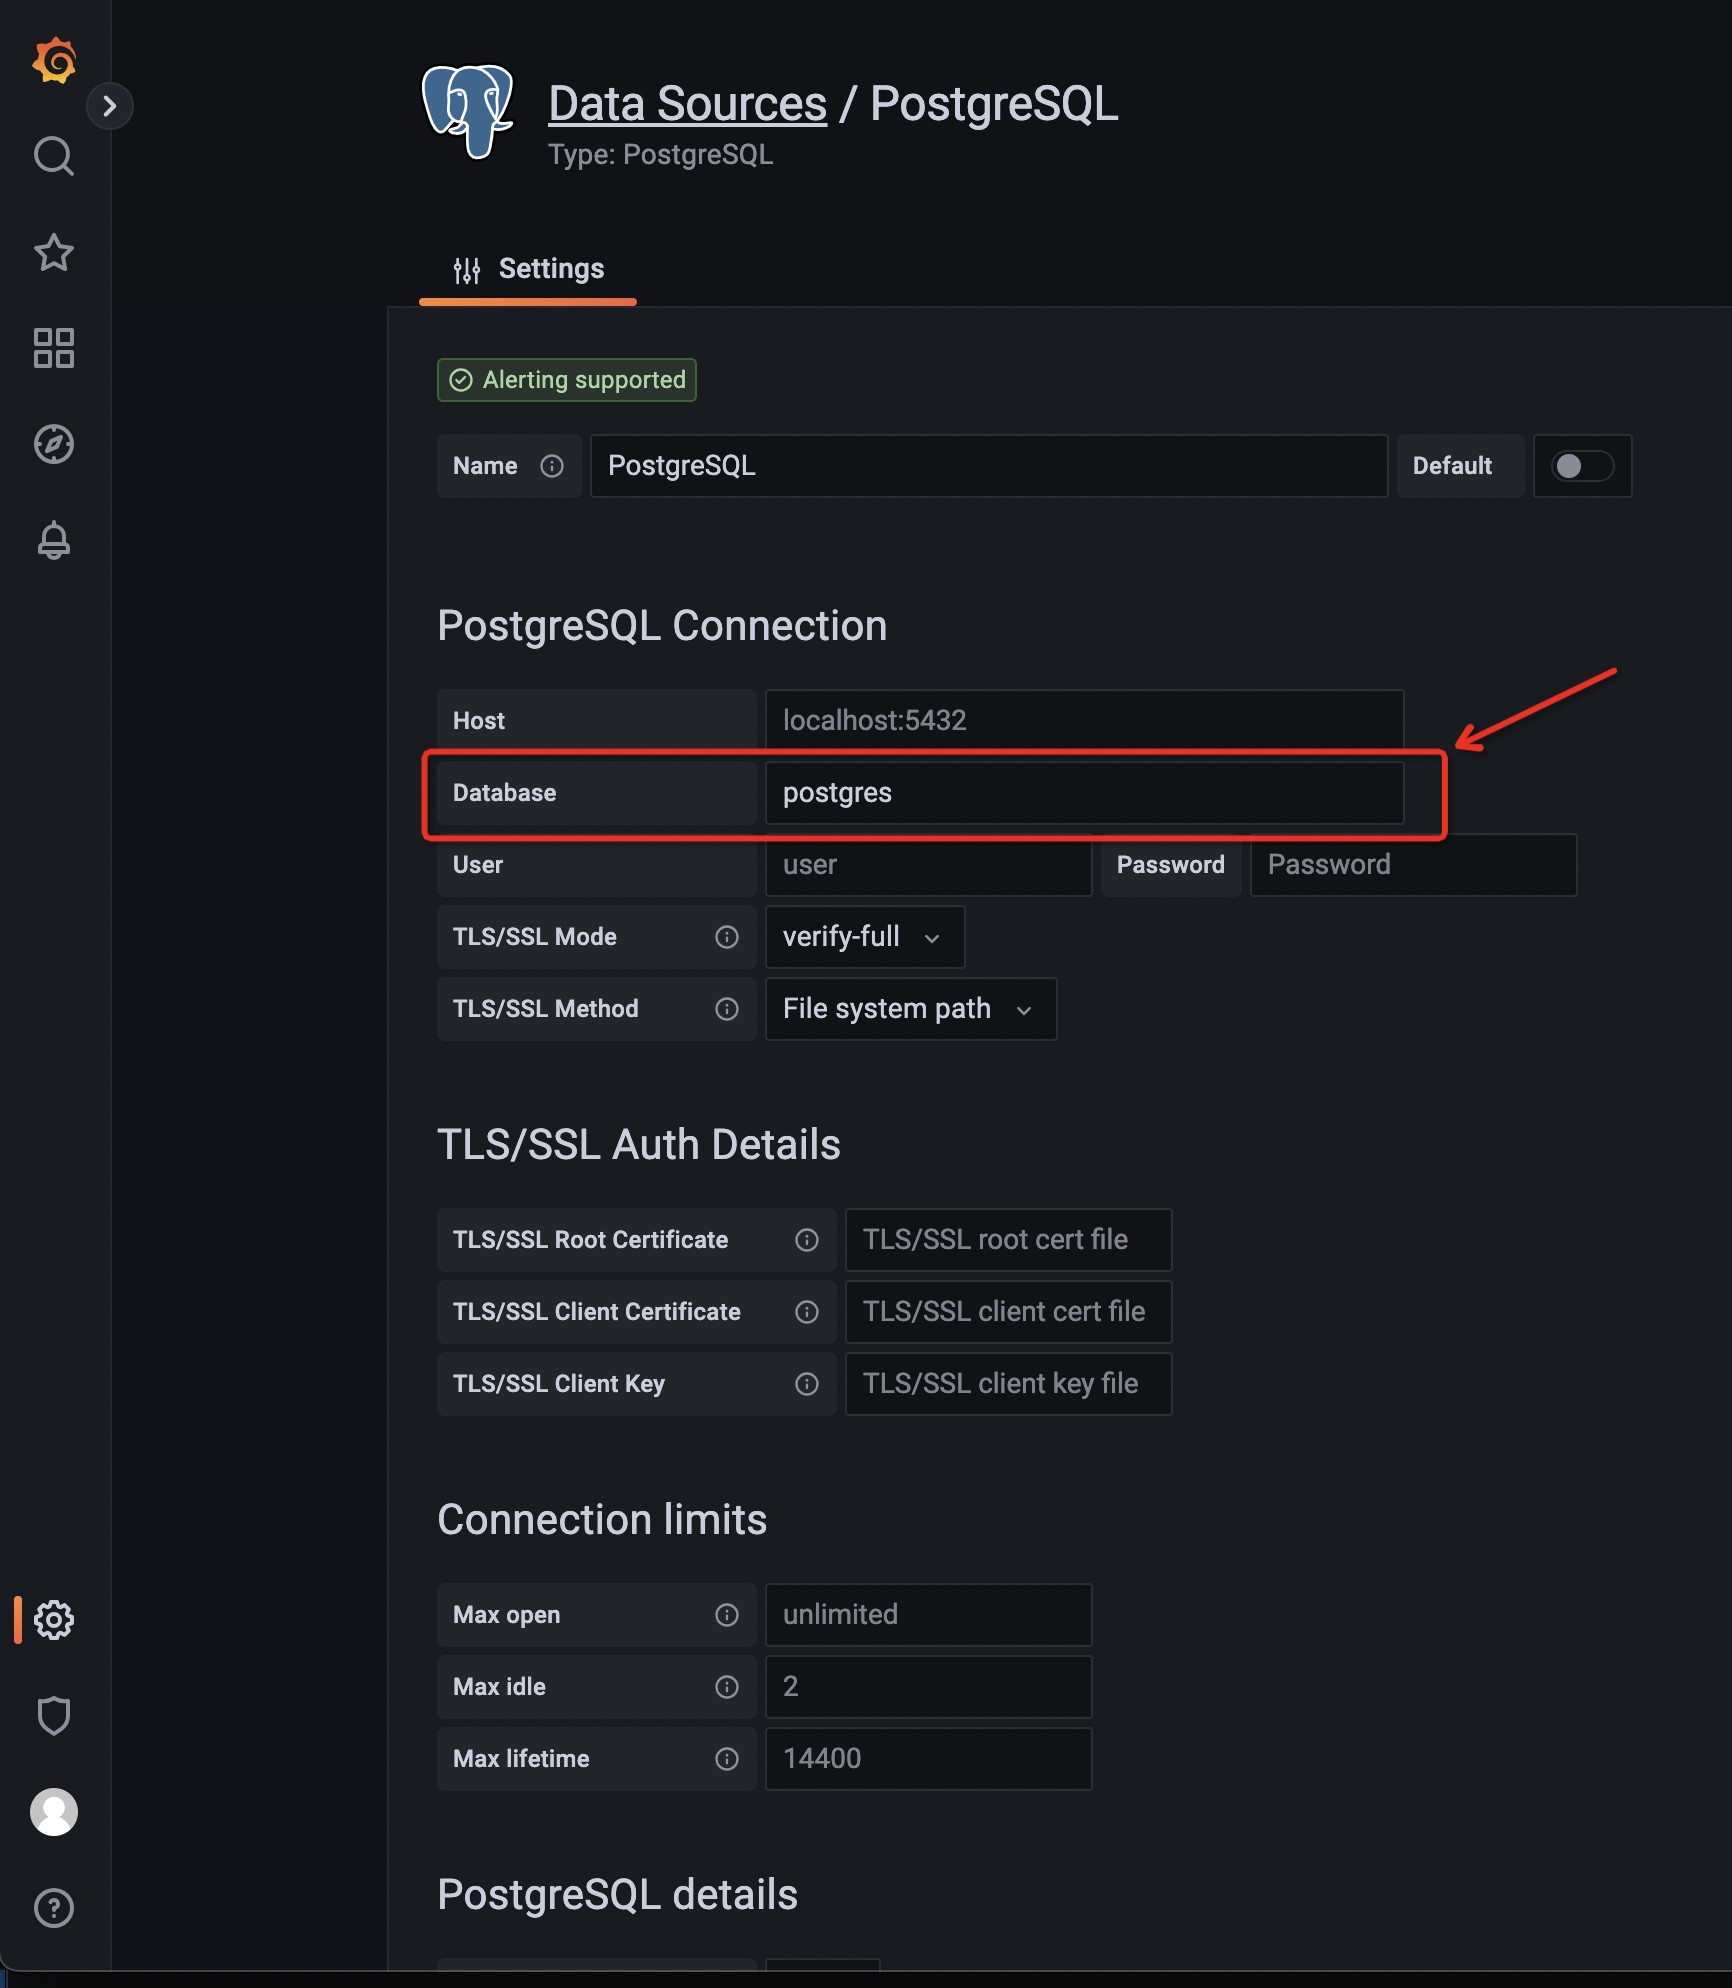
Import the dashboard configuration file
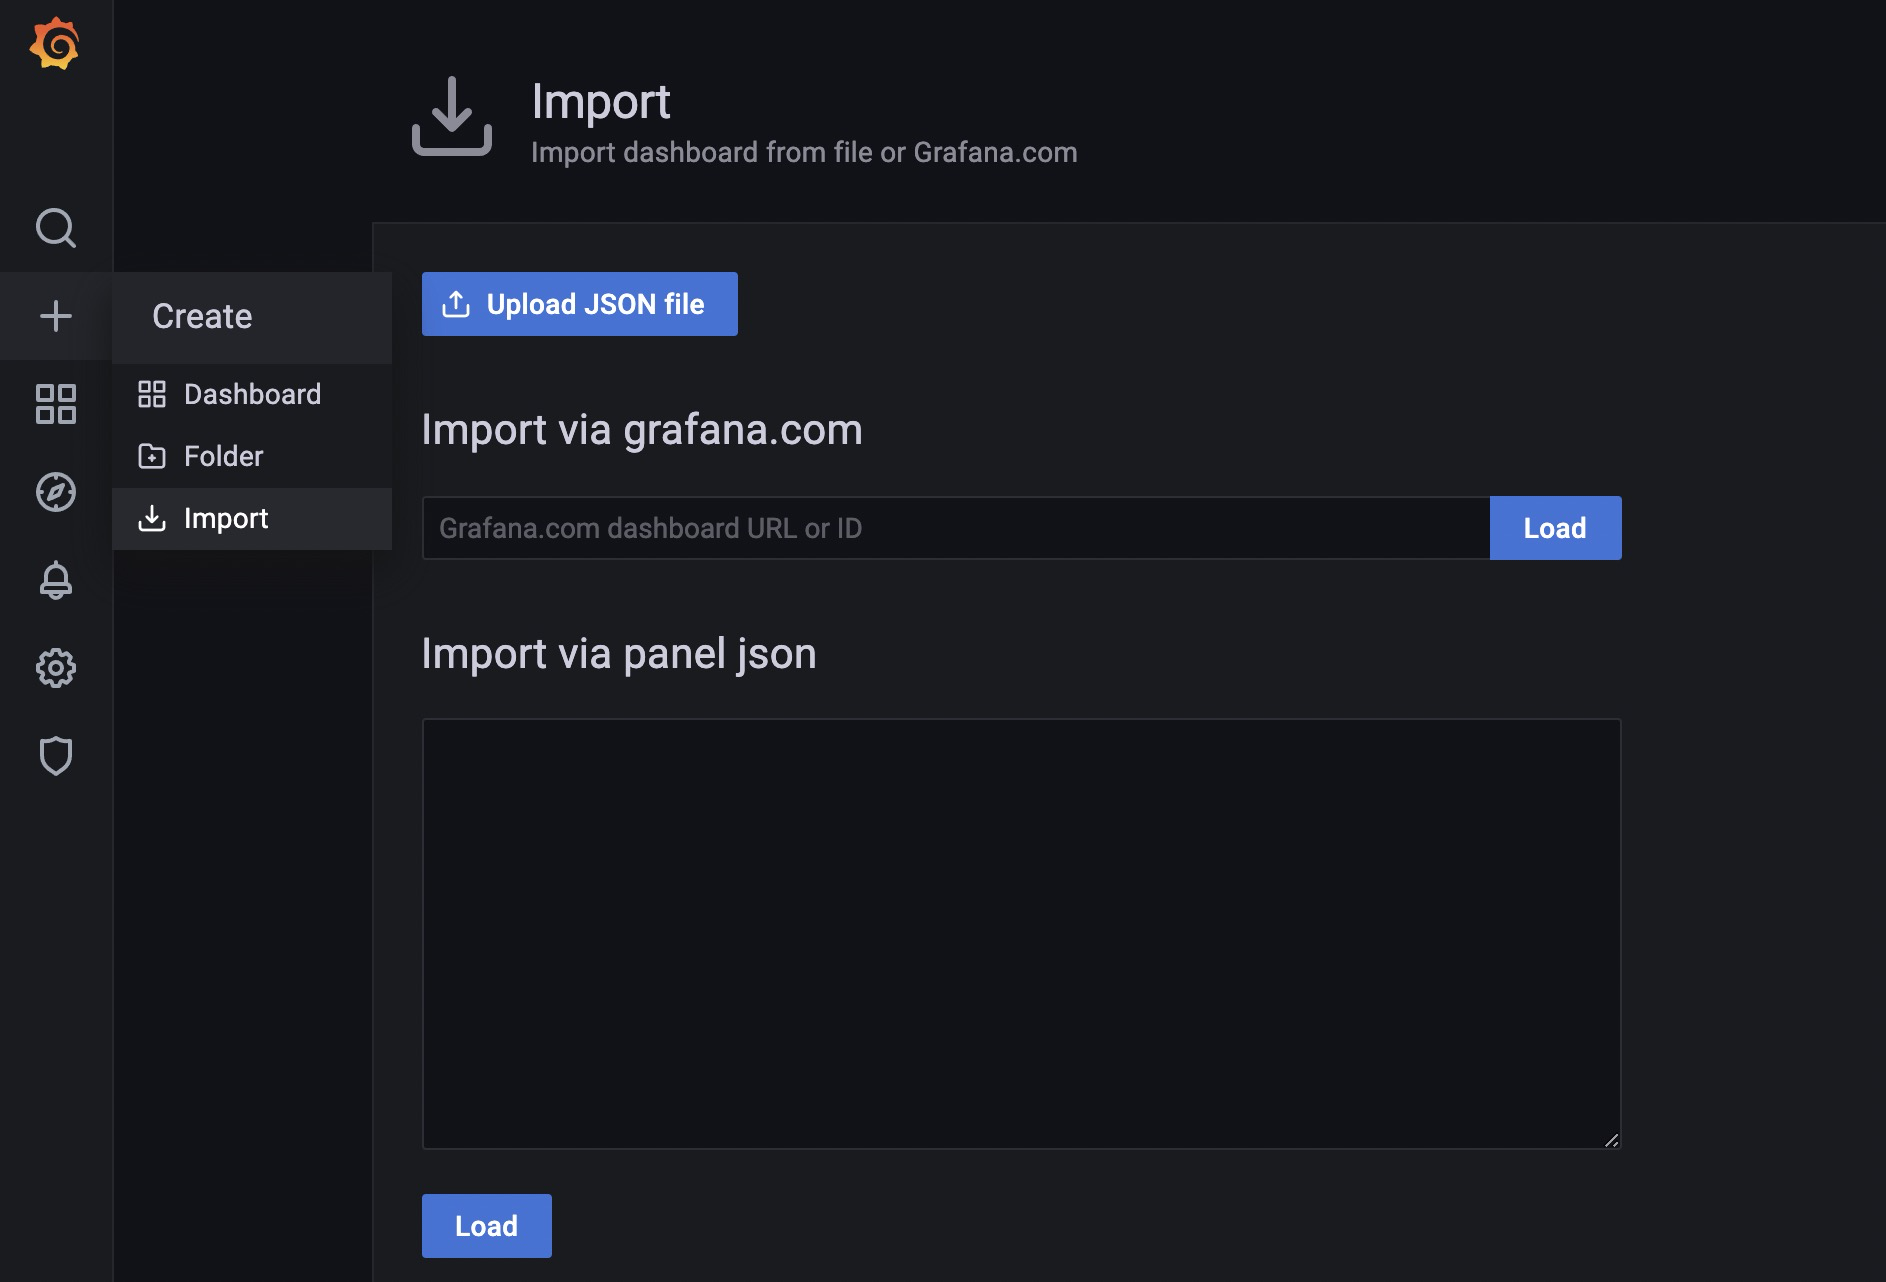
In the left-side navigation pane, choose + > Import.
On the Import page, click Upload JSON file and select the dashboard configuration file.
Download the dashboard configuration file: PolarDB Global AWR-1712645731515.json. Decompress the file before importing it.