Use storage analysis to monitor storage consumption in a PolarDB for MySQL cluster. The feature, integrated from Database Autonomy Service (DAS), shows estimated days of remaining storage, per-table space usage and fragmentation, and exception statistics.
Limitations
Storage analysis supports up to 20,000 tables per cluster.
On the Data Space tab, all statistics except physical file size are derived from
information_schema.tablesand may be up to 24 hours stale. Theinformation_schema_stats_expiryparameter controls the cache expiry period; the default is 86,400 seconds (24 hours).After you run
OPTIMIZE TABLE, the fragmentation percentage on the Data Space tab is not updated immediately. To see the current value, either runANALYZE TABLEor reduceinformation_schema_stats_expiryto a shorter interval.
View storage analysis
Log on to the PolarDB console.
In the upper-left corner, select the region where the cluster is deployed.
On the Clusters page, click the cluster ID.
In the left-side navigation pane, choose Diagnostics and Optimization > Quick Diagnostics.
Click the Storage Analysis tab.

On the Storage Analysis tab, two sub-tabs are available:
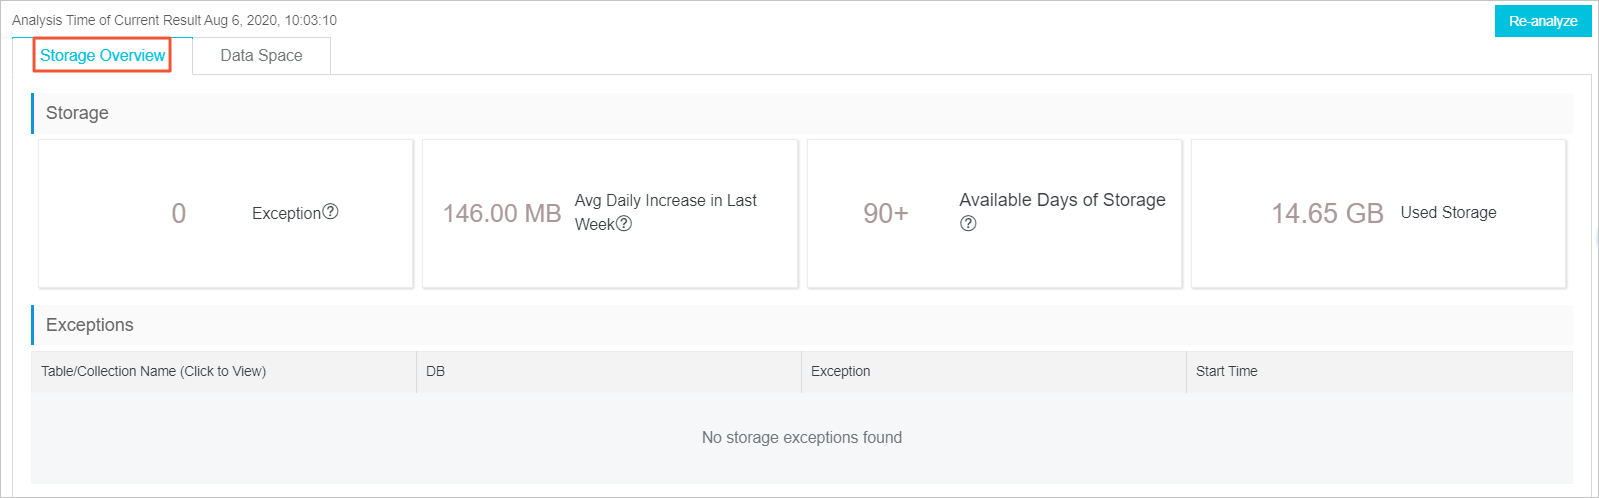
Space Overview (default) — shows overall storage usage and usage trends.
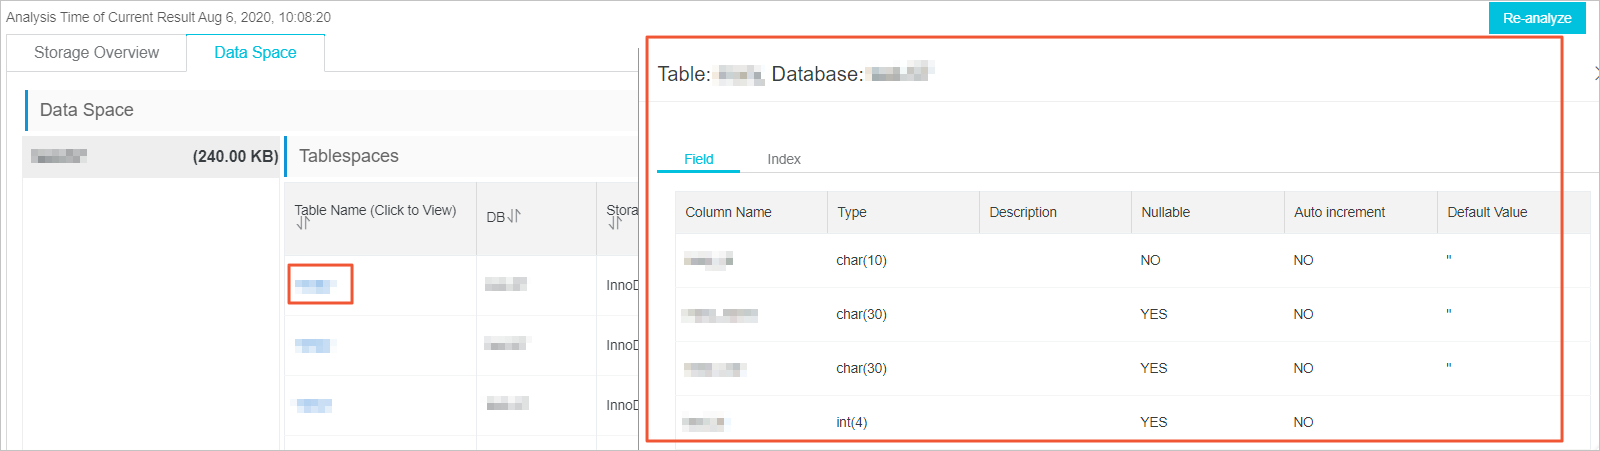
Data Space — shows storage usage broken down by database and table. Click a table name to view its fields and indexes.