The Real-time Monitoring page lets you watch live performance metrics for each node in your PolarDB for MySQL cluster — without waiting for delayed reports or setting up additional alerting. Powered by Database Autonomy Service (DAS), it surfaces key indicators like queries per second (QPS), transactions per second (TPS), and network traffic so you can assess cluster health at a glance.
Prerequisites
Before you begin, make sure you have:
-
A PolarDB for MySQL cluster
-
Access to the PolarDB console
What you can monitor
The Real-time Monitoring page shows live data for every node in the cluster:
| Category | Metrics |
|---|---|
| Throughput | QPS (queries per second), TPS (transactions per second) |
| Network | Network traffic transmitted through the cluster |
| Server | Server information |
| Buffer Pool | Buffer pool information |
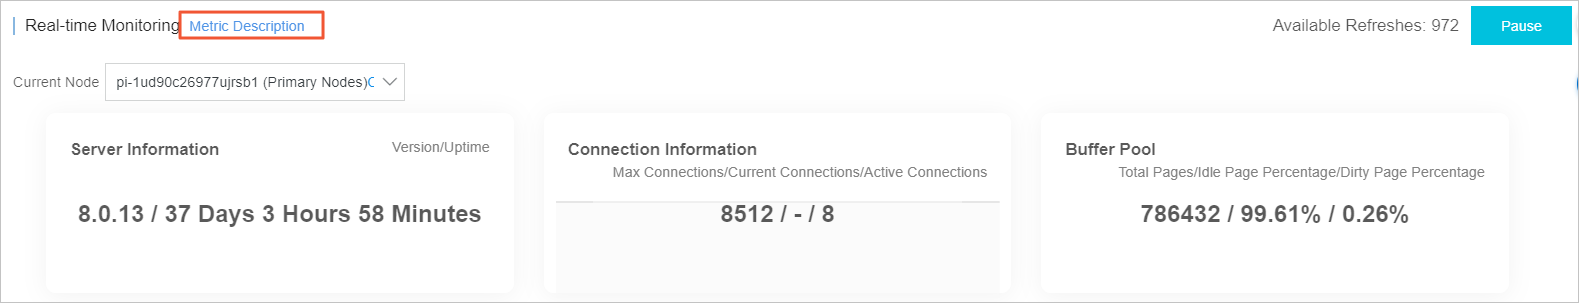
To see a full definition of each metric, click Metric Description in the upper-left of the Real-time Monitoring page.
View real-time performance metrics
-
Log on to the PolarDB console.
-
In the upper-left corner, select the region where your cluster is deployed.
-
On the Clusters page, click the ID of the target cluster.
-
In the left-side navigation pane, choose Diagnostics and Optimization > Quick Diagnostics.
-
On the Real-time Monitoring page, review the performance details for each node, including server information and buffer pool information.
NoteClick Metric Description in the upper-left to see definitions for each metric shown on the page.
-
Choose the view that matches your monitoring goal:
-
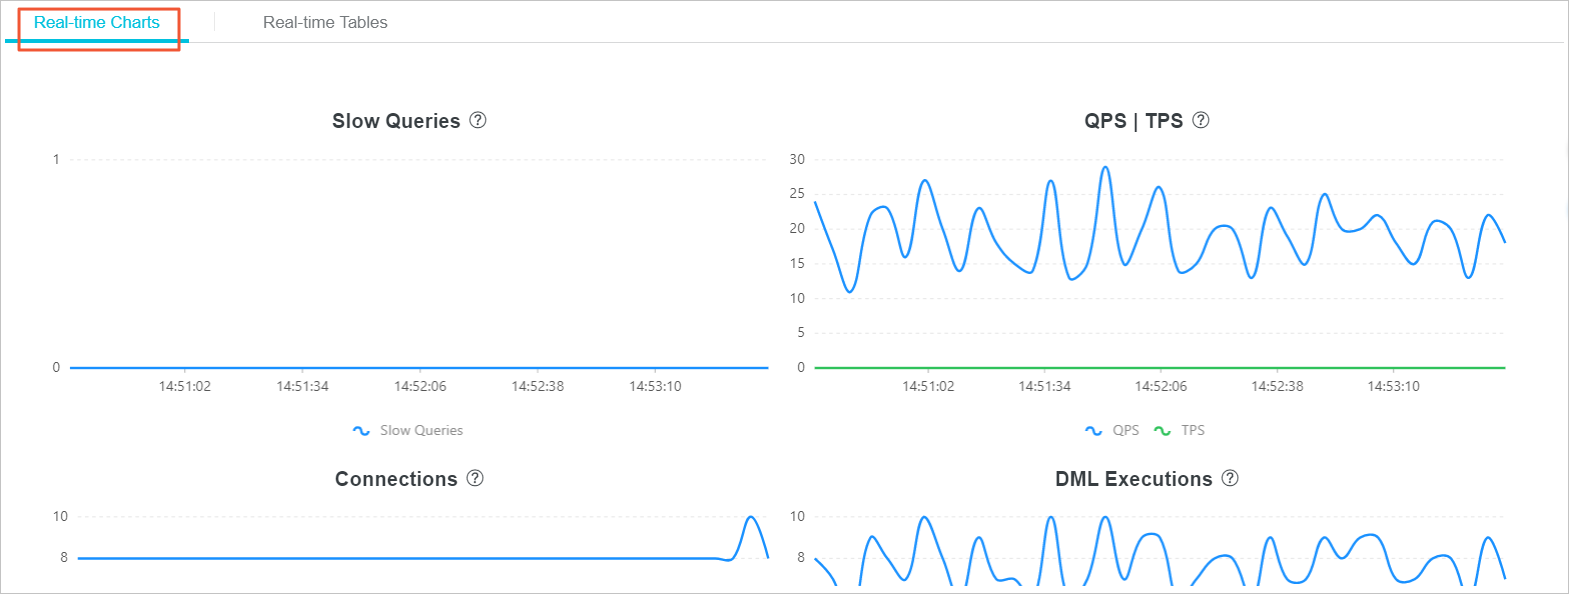
Real-time Charts tab: Displays line charts for each metric over time. Use this tab to monitor the trends of performance.
-
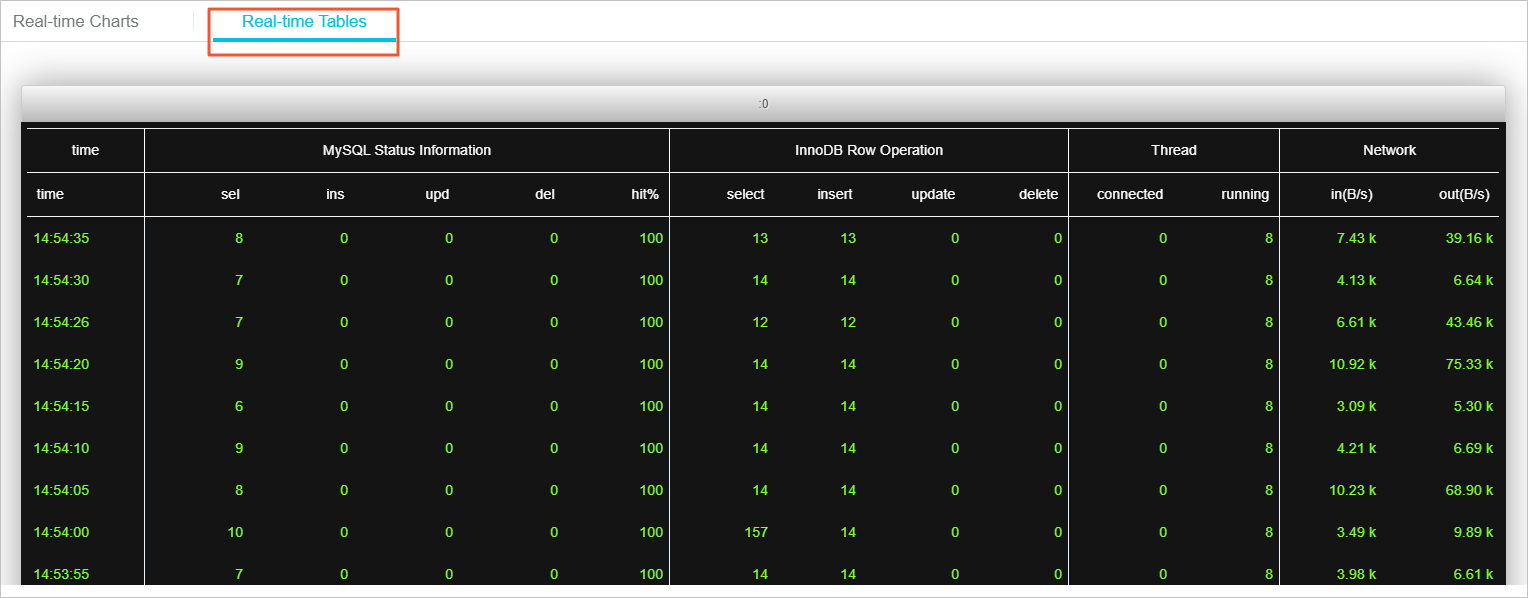
Real-Time Tables tab: Displays specific performance values for each metric. Use this tab when you need a precise reading rather than a visual trend.
-