PolarDB Serverless is a cloud-native database service integrated with mature technologies detailed in the research paper PolarDB Serverless: A Cloud Native Database for Disaggregated Data Centers. It is powered by two core technologies, global consistency (high-performance mode) and imperceptible failover within seconds, and delivers robust performance in horizontal scaling and cross-node failover. This topic uses Sysbench to test the scalability of PolarDB Serverless. You can test the scalability of Serverless by using the methods described in this topic.
Test configurations
The ECS instance and the PolarDB for MySQL cluster are deployed in the same region and zone and on the same VPC.
PolarDB for MySQL cluster configurations:
One cluster
Billing method: Serverless
Database engine: MySQL 8.0.1
Product edition: Enterprise Edition
Storage type: PSL5
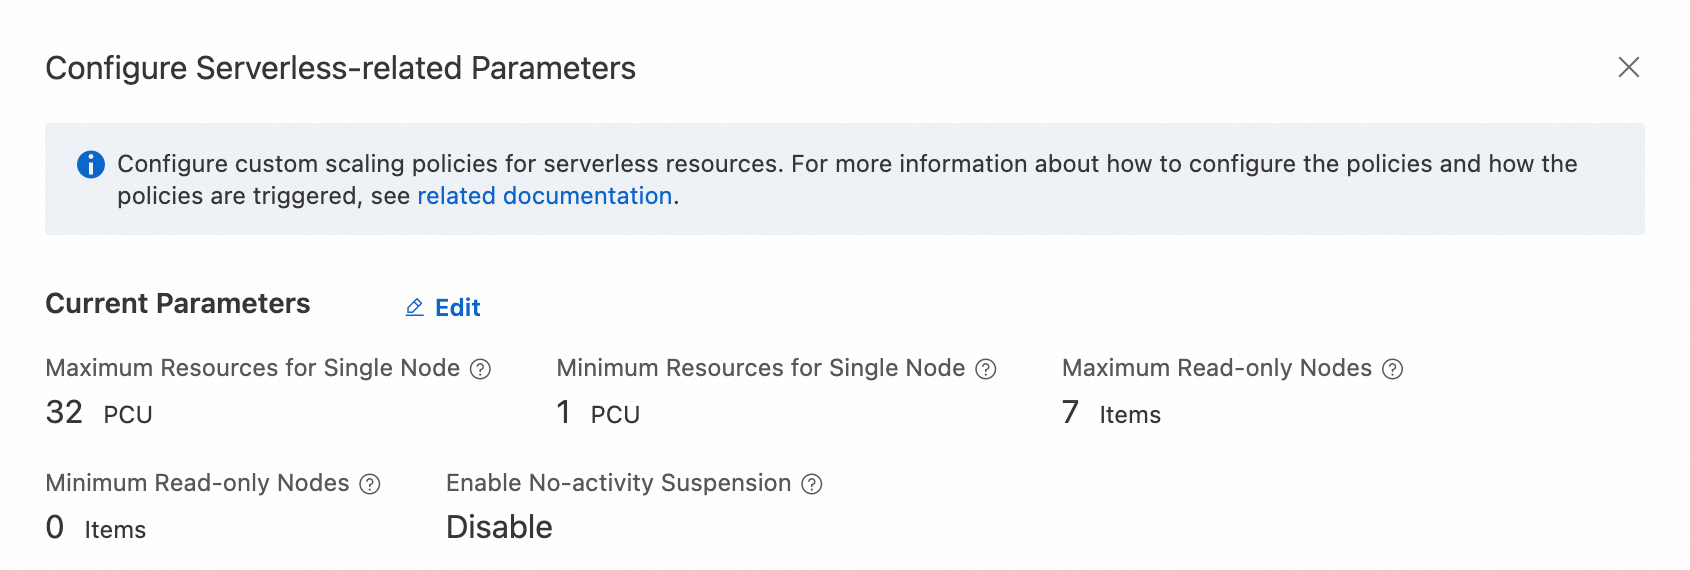
NoteWhen you purchase a Serverless cluster, use the default settings for the maximum and minimum numbers of read-only nodes, and the maximum and minimum PCUs per node. For more information, see Create a serverless cluster.
ECS instance configurations:
One instance
Instance type: ecs.g7.4xlarge(16 vCPU 64 GiB)
Image: Alibaba Cloud Linux 3.2104 LTS 64-bit
System disk: ESSD PL0, 100 GB
Test tool
Sysbench is an open-source and modular tool that can use multiple threads to test the performance of databases (such as MySQL), including the CPU, memory, thread, and I/O, across different platforms. The tool supports multi-threaded testing and provides flexible configuration options.
Preparations
Purchase environment
Purchase an ECS instance and a PolarDB for MySQL Serverless cluster based on the test configurations.
Install Sysbench
Use the root account to log on to the ECS instance and install Sysbench.
sudo yum -y install sysbenchIn this example, the Alibaba Cloud Linux operation system is used. If you are installing a different operating system, you must modify the installation command. For more information, see Sysbench documentation.
Configure cluster information
Log on to the PolarDB console, create a database, create a database account, and obtain the endpoint and port number.
If the ECS instance and PolarDB for MySQL cluster are on the same VPC, you do not need to configure a whitelist for the cluster. After you create a cluster, the system adds the CIDR block of the VPC to the default group.
If the ECS instance and PolarDB for MySQL cluster do not belong to the same VPC, you can add the public IP address of the ECS instance to a new IP address whitelist or add the security group of the ECS instance to the whitelist of the cluster.
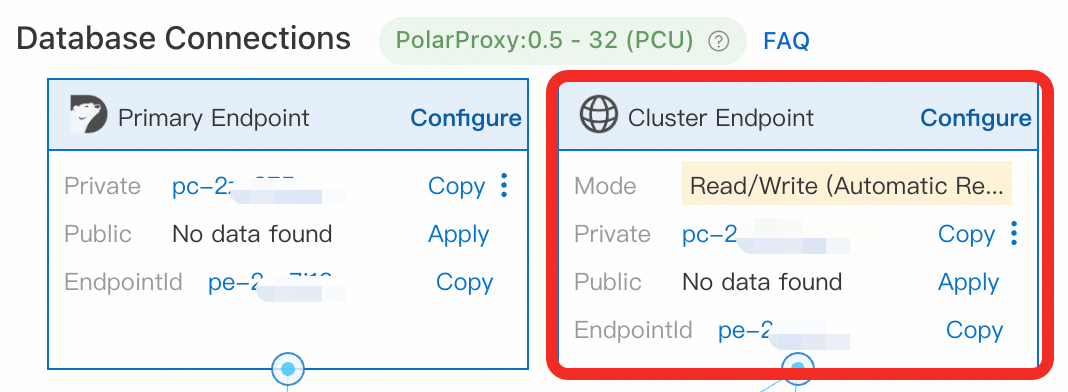
Use the cluster endpoint instead of the primary endpoint.
Prepare data
Use Sysbench to prepare 128 tables in the PolarDB for MySQL cluster. Each table contains 1,000,000 rows of data. During the execution, the Serverless cluster specifications may be automatically scaled. After the data is prepared, wait for 3 to 5 minutes until the specifications of the primary node return to 1 PCU. Run the following command and adjust the following parameters based on the actual situation:
Serverless cluster parameters:
<host>: the cluster endpoint.<port>: the port number of the cluster endpoint. Default value: 3306.<user>: the database account.<password>: the password of the database account.<database>: the name of the database.
Other parameters:
--db-ps-mode:disableindicates that the Prepared Statements feature is disabled to ensure that all transactional SQL statements are executed as the original SQL statements.--threads: the number of threads. The number of threads affects the load and performance of the cluster. In this example, the number of threads is represented by xxx. 32 is used in the example, indicating that 32 threads are used in the data preparation process, and the estimated duration is 5 minutes.
sysbench /usr/share/sysbench/oltp_read_write.lua --mysql-host=<host> --mysql-port=<port> --mysql-user=<user> --mysql-password=<password> --mysql-db=<database> --tables=128 --table-size=1000000 --report-interval=1 --range_selects=1 --db-ps-mode=disable --rand-type=uniform --threads=32 --time=12000 prepareScale-up testing
This Sysbench test is performed to measure the database's performance, proving the primary node can scale up or down based on workloads.
Adjust serverless configurations
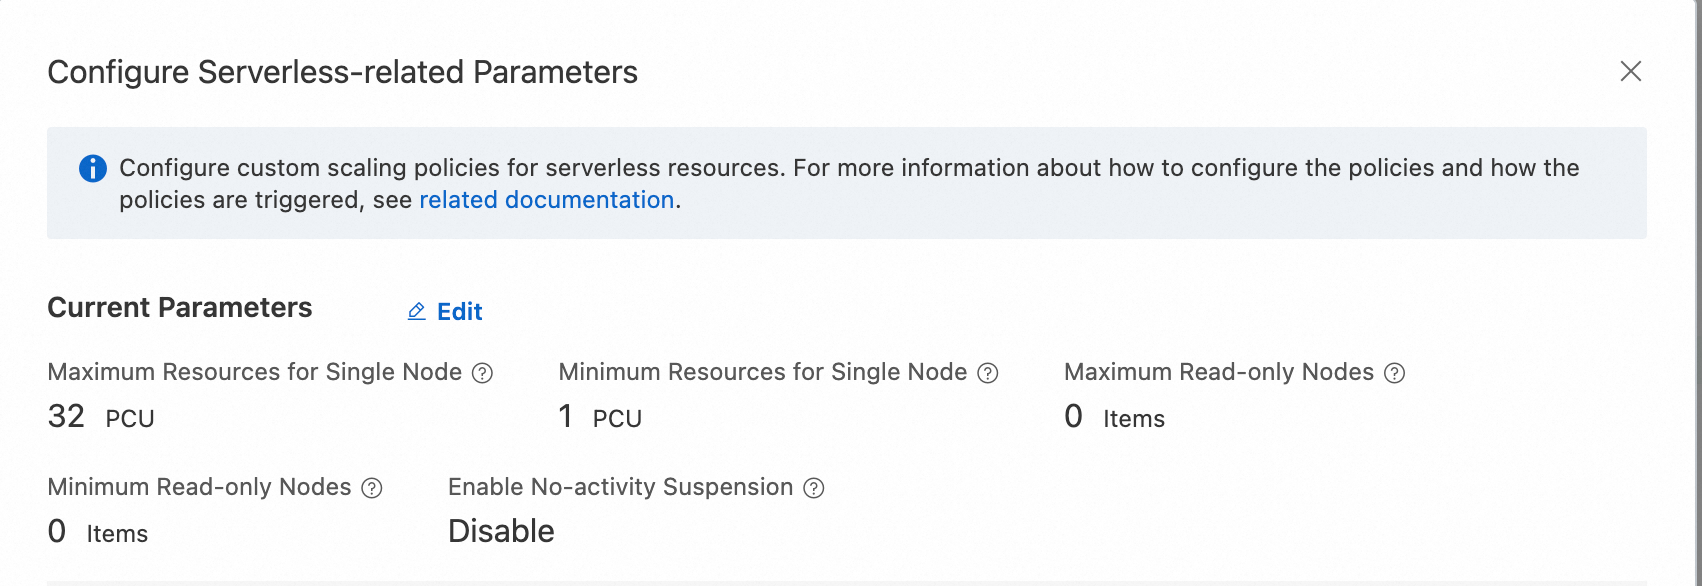
During the scale-up test for a single node, make sure that read-only node scaling is not used during the stress test. Log on to the PolarDB console. In the Database Nodes section of the Cluster Details page, set Maximum PCUs per Node to 32, Minimum PCUs per Node to 1, and Maximum Number of Read-Only Nodes and Minimum Number of Read-Only Nodes to 0. 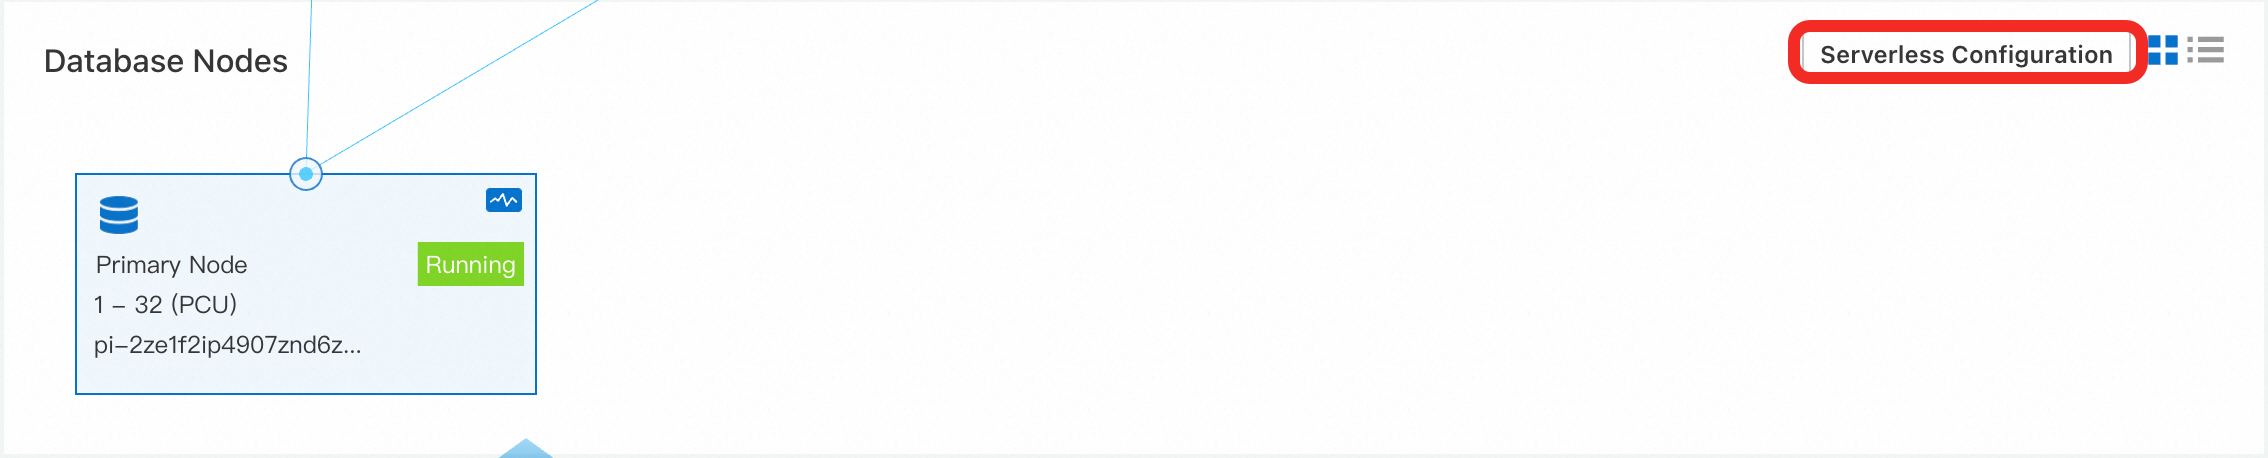
Initial verification: low workloads (16 threads)
First, a simple test is conducted to evaluate the test results of 16 threads to check the scalability of Serverless.
Run the following command. Set the
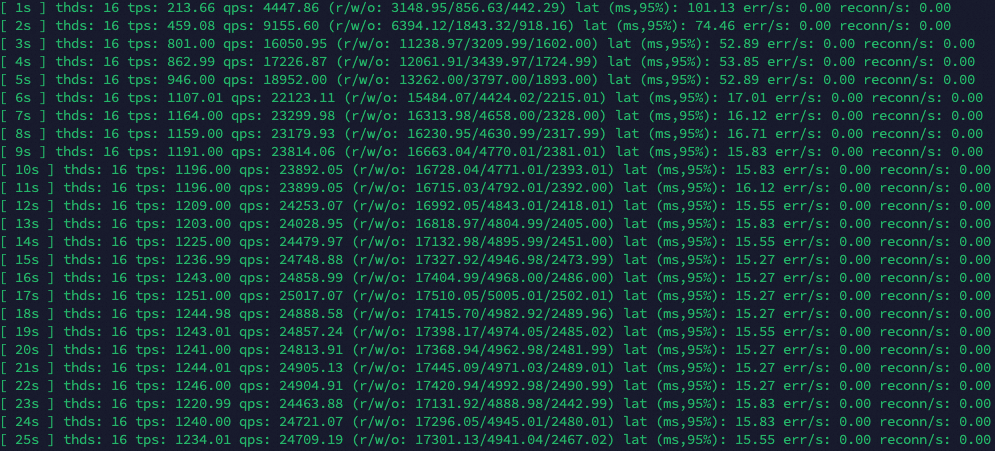
--threadsparameter to 16. Adjust other parameters accordingly. For more information, see Configuration parameters.sysbench /usr/share/sysbench/oltp_read_write.lua --mysql-host=<host> --mysql-port=<port> --mysql-user=<user> --mysql-password=<password> --mysql-db=<database> --tables=128 --table-size=1000000 --report-interval=1 --range_selects=1 --db-ps-mode=disable --rand-type=uniform --threads=16 --time=12000 runThe stress testing results. According to the Sysbench test results, at a concurrency of 16 threads, the throughput (TPS) increased over time while the latency (LAT) decreased, both eventually reaching stable values. This shows that the system performance has been significantly improved after the Serverless scalability is triggered.
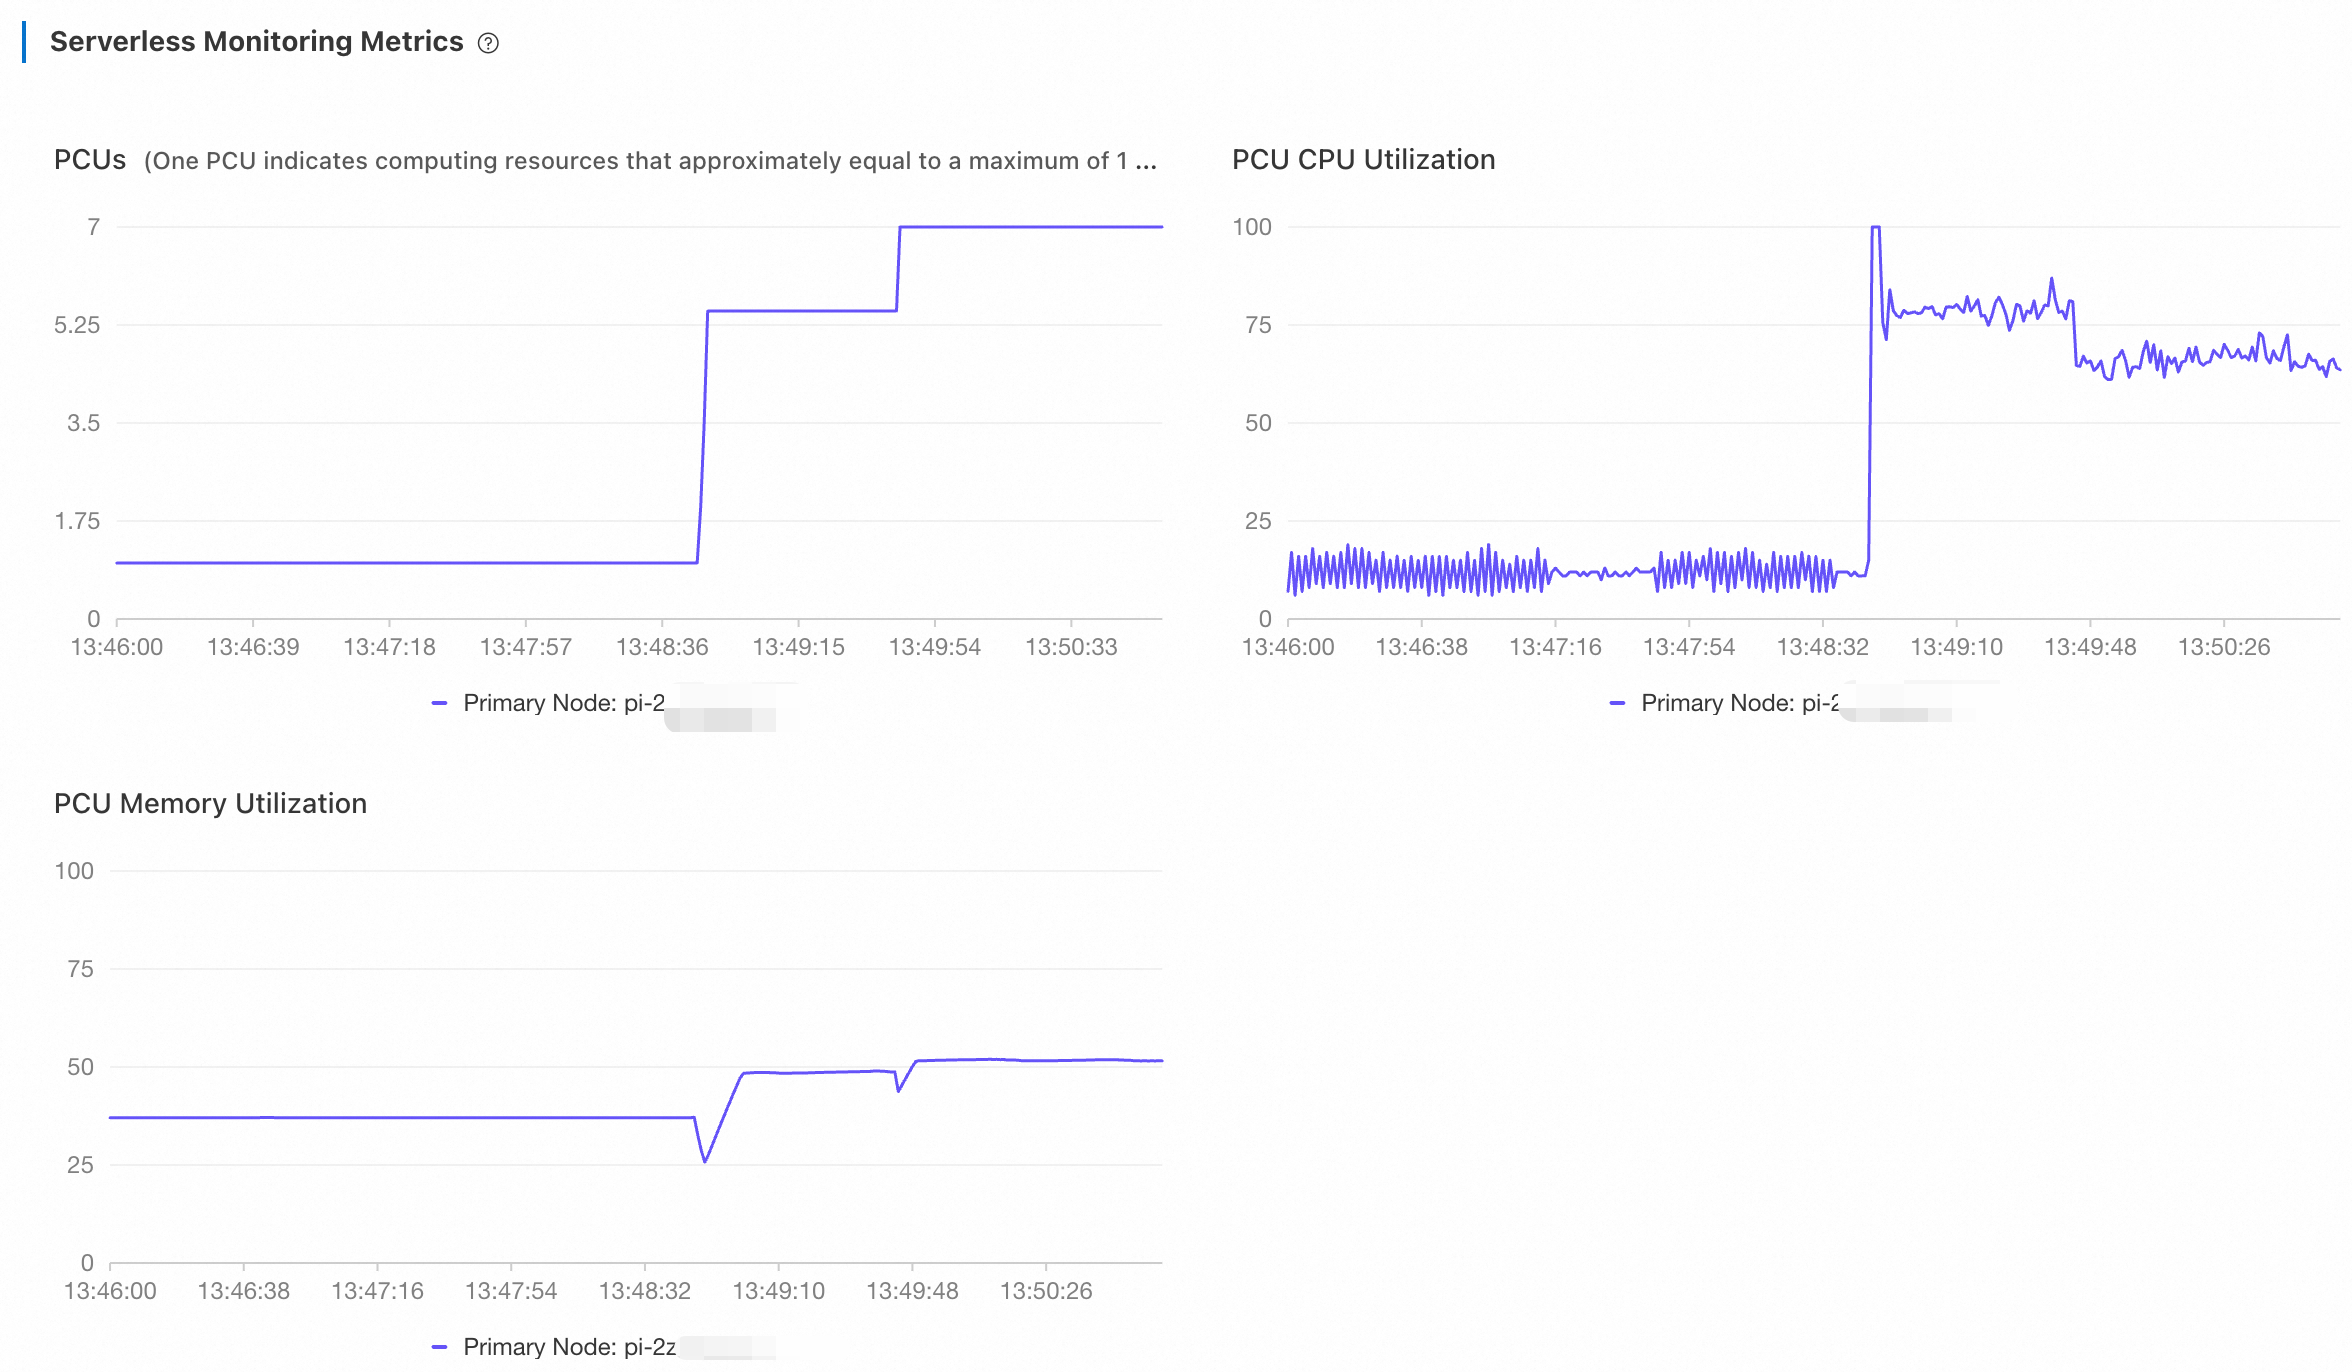
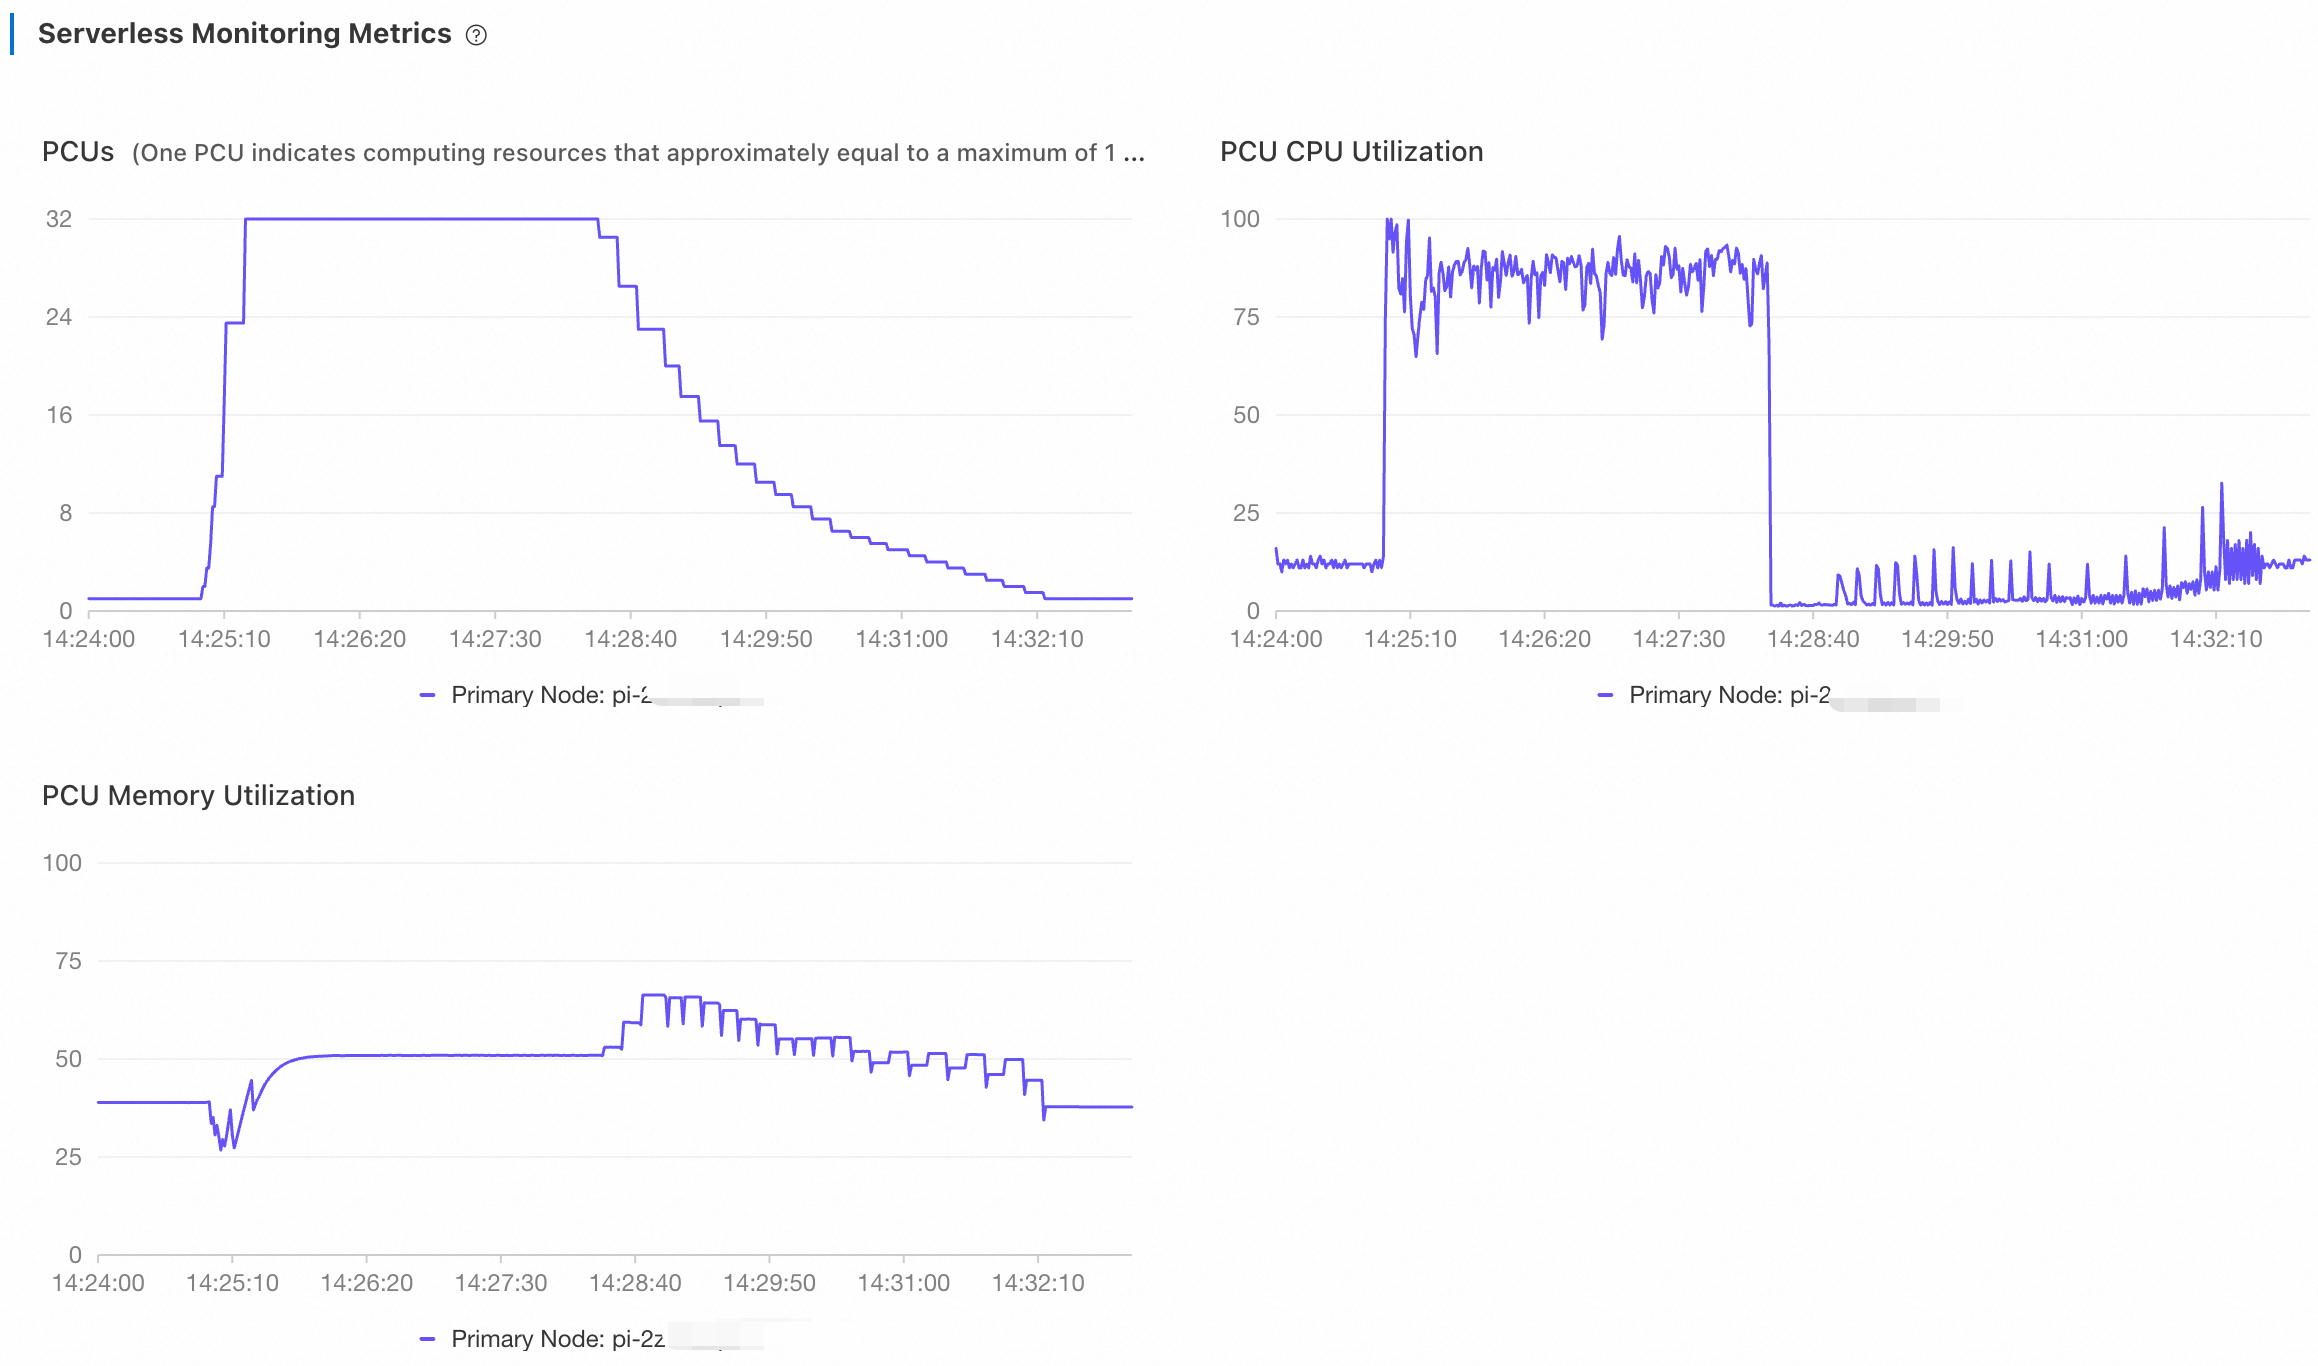
Return to the PolarDB console. On the Performance page, view the metrics of Serverless. Choose Last 5 Minutes from the drop-down list at the top center of the page to view the monitoring information.
The number of PCUs increases from 1 to 7 and then remains unchanged. During the scaling, CPU utilization is gradually reduced. while memory utilization saw sharper drops. The database then used the additional memory to increase its computing power, such as by expanding its buffer pool. This resulted in a gradual increase in memory utilization until it finally reached a stable state. The database then used the additional memory to increase its computing power, such as by expanding its buffer pool. This resulted in a gradual increase in memory utilization until it finally reached a stable state.
Stop the test and wait for 5 minutes. Then, adjust the time range to the last 10 minutes to view the monitoring information.
The number of PCUs experienced stepwise drops from 7 to 1, and CPU utilization instantly fell close to 0. Because
UPDATEoperations were included in this read/write test, PolarDB continued to executePURGE UNDOoperations, which occupied a small amount of CPU. Memory utilization experienced a temporary drop before rebounding during a scale-down activity. This temporary decrease occurred because the system first adjusted its memory configuration settings, such as the buffer pool and the table open cache, to free up cache memory. Subsequently, the system reduced the actual memory capacity, resulting in an increase in memory utilization.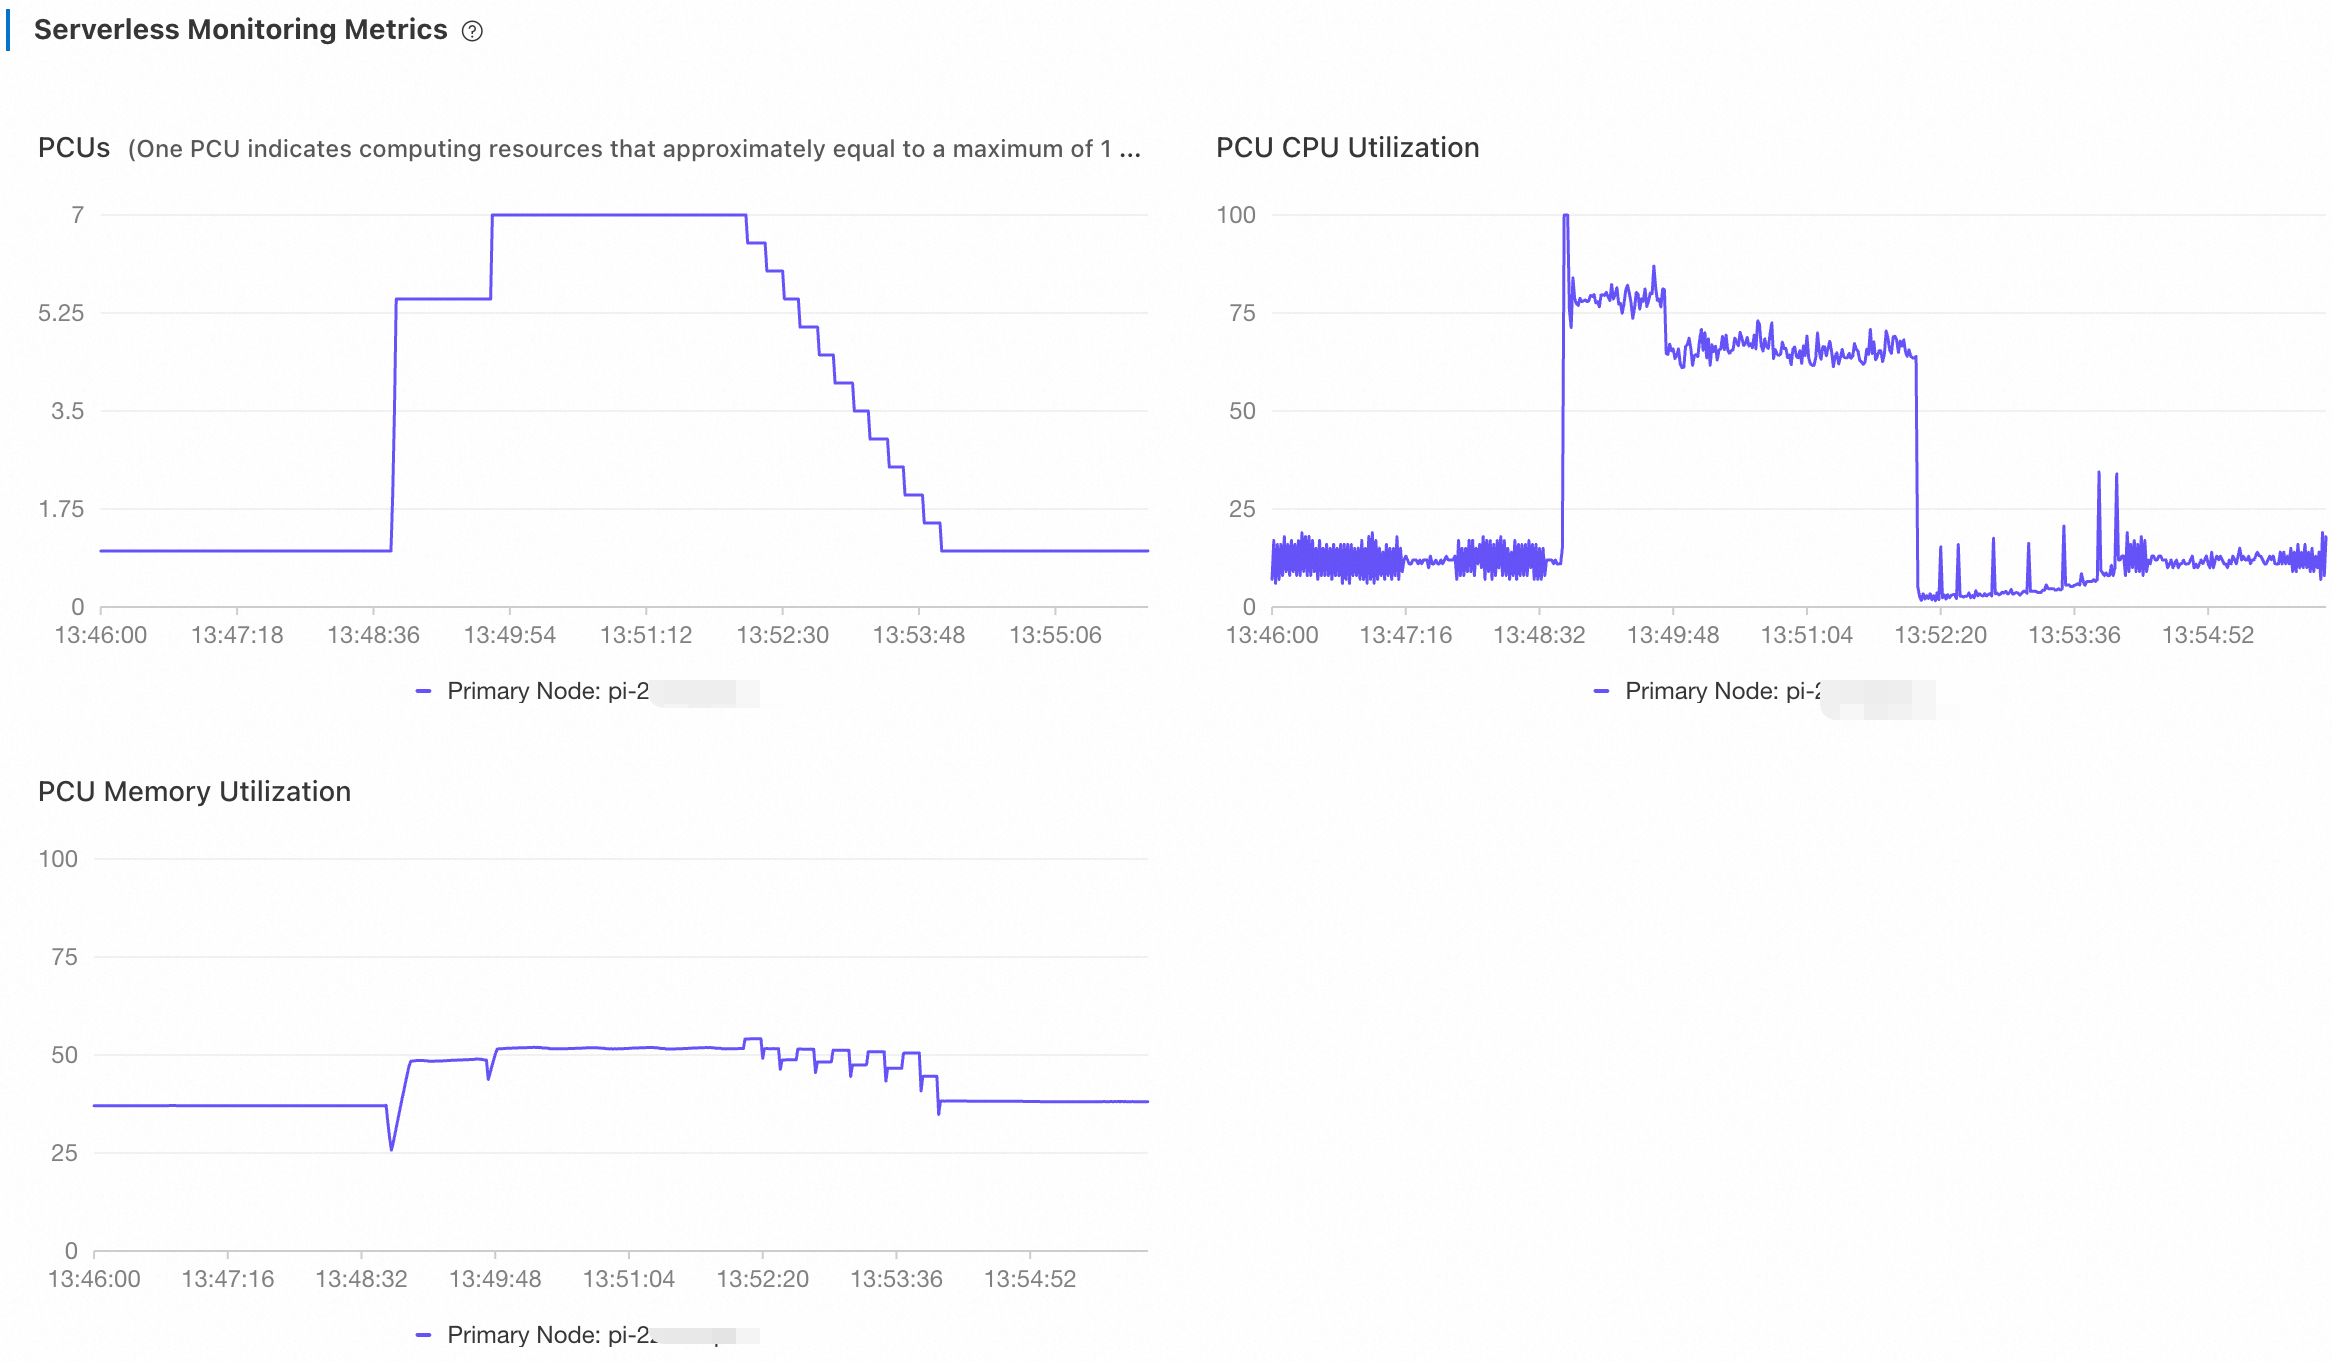
Further verification: high workloads (128 threads)
Next, set the (--threads parameter to 128 and check the time required for the PolarDB Serverless cluster to scale up to the maximum value of 32 PCUs. After a period of time, stop the test.
Run the following command. Set the
--threadsparameter to 128. Adjust other parameters accordingly. For more information, see Configuration parameters.sysbench /usr/share/sysbench/oltp_read_write.lua --mysql-host=<host> --mysql-port=<port> --mysql-user=<user> --mysql-password=<password> --mysql-db=<database> --tables=128 --table-size=1000000 --report-interval=1 --range_selects=1 --db-ps-mode=disable --rand-type=uniform --threads=128 --time=12000 runTest results: The changes in TPS and LAT are obvious.
Log on to the PolarDB console. On the Performance page, view the metrics of Serverless. Adjust the time range to view the monitoring information.
It took about 23 seconds for the cluster to scale up to 32 PCUs and about 233 seconds to scale down.
Scale-out testing
In a traditional PolarDB for MySQL cluster (with a single primary and multiple read-only nodes), read-only nodes suffer from binary log replication latency. Therefore, transaction-related read requests are not forwarded to read-only nodes. Only read requests that are not consistency-sensitive, such as report queries, are directed to them. Meanwhile, as only the binary log is replicated, read-only nodes cannot process reads after writes within the same transaction.
PolarDB Serverless supports global consistency (high-performance mode), which ensures the implementation of strong consistency during the scaling out of a serverless cluster. This feature is automatically enabled for newly created read-only nodes. Coupled with transaction splitting in PolarProxy, this feature can easily route read requests to read-only nodes, regardless of whether they are across transactions, before transactions, or after writes within the same transactions, while ensuring global consistency. This frees up the capacity of the primary node to handle more write requests. With the global consistency feature, a Serverless cluster allows access through a single cluster endpoint, eliminating the concern about inconsistent reads. You do not have to worry about whether your requests are handled by the primary node or a read-only node.
Adjust serverless configurations
During the multi-node scaling test, make sure that read-only nodes are automatically scaled during the test. Log on to the PolarDB console. On the Cluster Details page, modify the serverless configurations in the Database Nodes section. Set Maximum PCUs per Node to 32, Minimum PCUs per Node to 1, Maximum Number of Read-Only Nodes to 7, and Minimum Number of Read-Only Nodes to 0.
Initial verification: low workloads (128 threads)
First, conduct a test of 128 threads to check the scalability of Serverless.
Run the following command. Set the
--threadsparameter to 128. Adjust other parameters accordingly. For more information, see Configuration parameters.NoteBefore the test, ensure that the primary uses 1 PCU after the previous test ends.
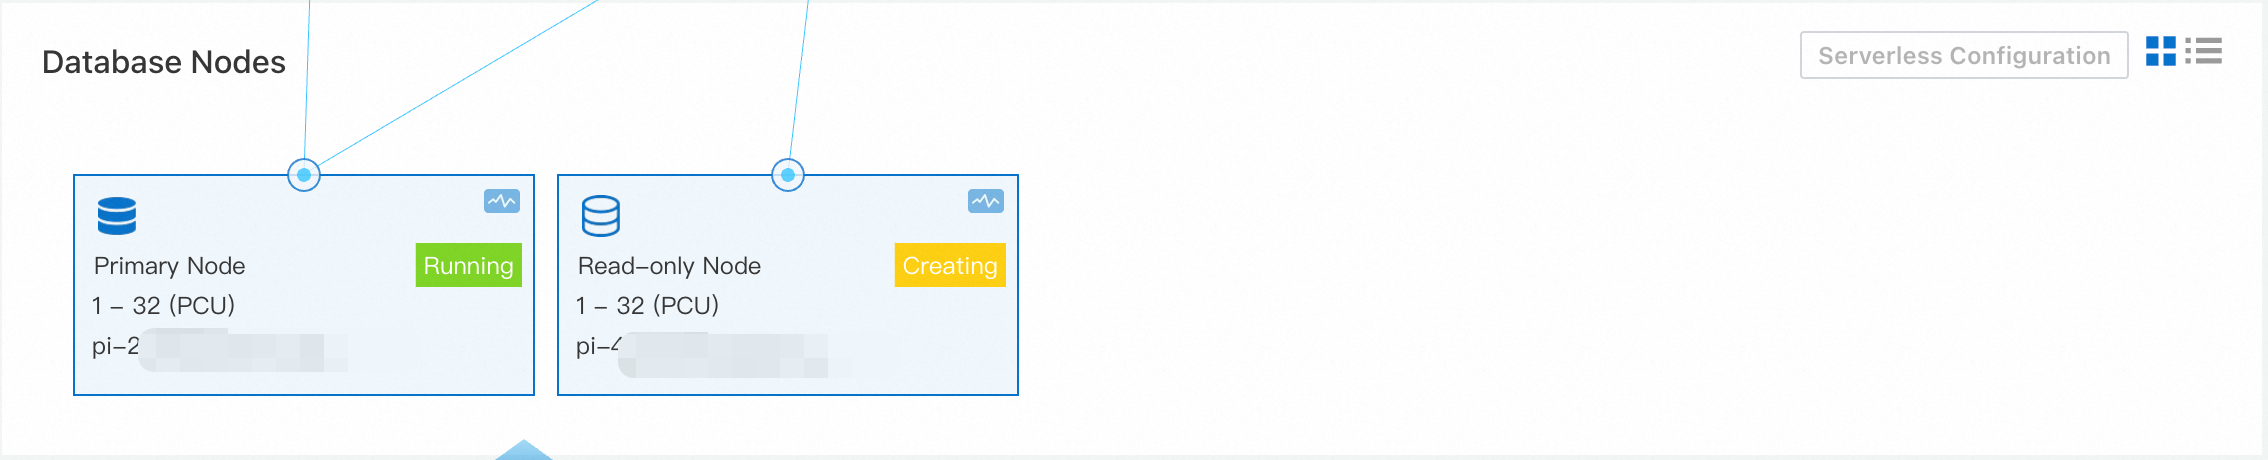
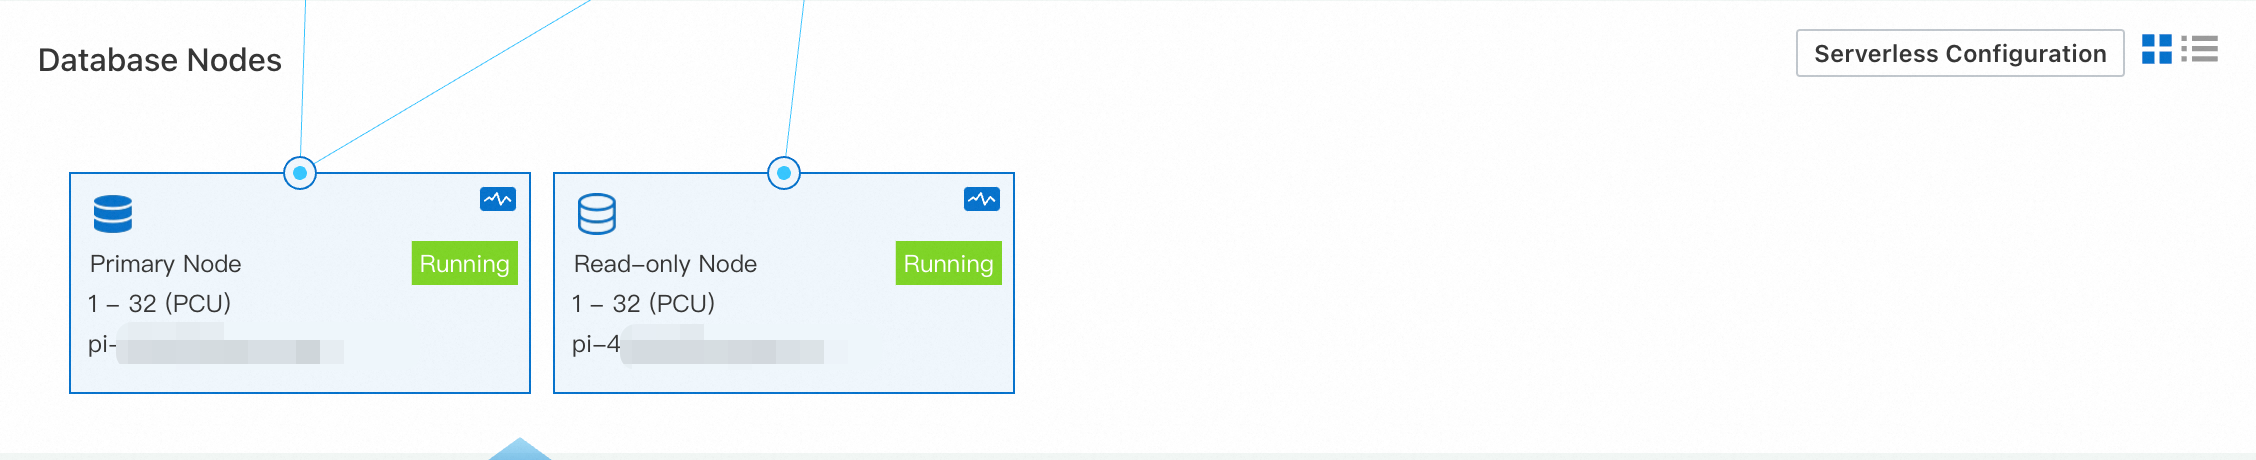
sysbench /usr/share/sysbench/oltp_read_write.lua --mysql-host=<host> --mysql-port=<port> --mysql-user=<user> --mysql-password=<password> --mysql-db=<database> --tables=128 --table-size=1000000 --report-interval=1 --range_selects=1 --db-ps-mode=disable --rand-type=uniform --threads=128 --time=12000 runLog on to the PolarDB console. In the Database Nodes section of the Basic Information page of the serverless cluster, a new read-only node was added some time after the test began.
When the number of requests became stable, no new read-only nodes were created.
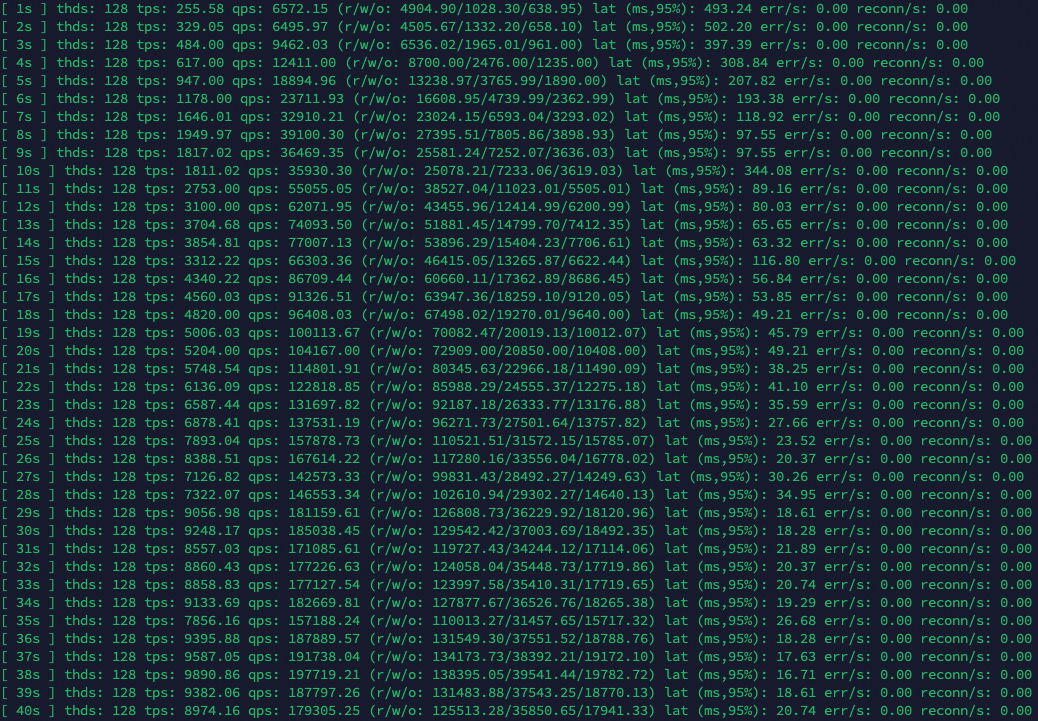
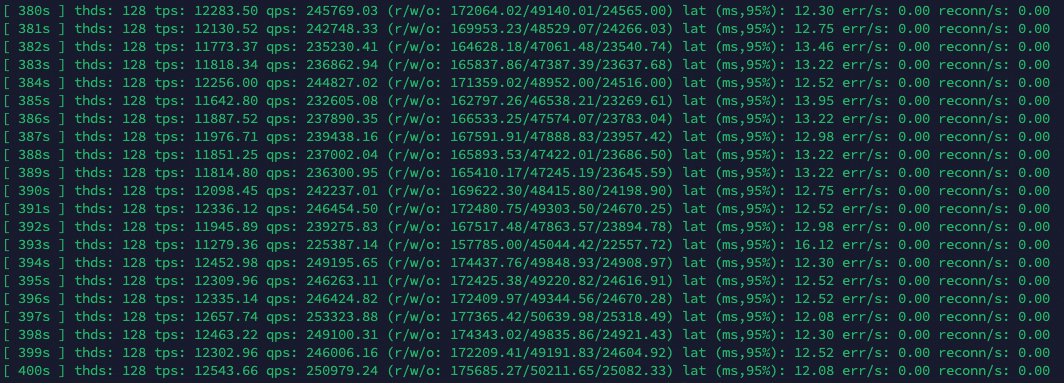
After the cluster entered the stable state, Sysbench returned output as follows: At the same stress level, this scale-out test showed slightly lower performance than the previous scale-up test, changing 170,000-190,000 from to 230,000-250,000 queries per second. Based on the QPS performance, the maximum throughput of the single-node test has been exceeded.
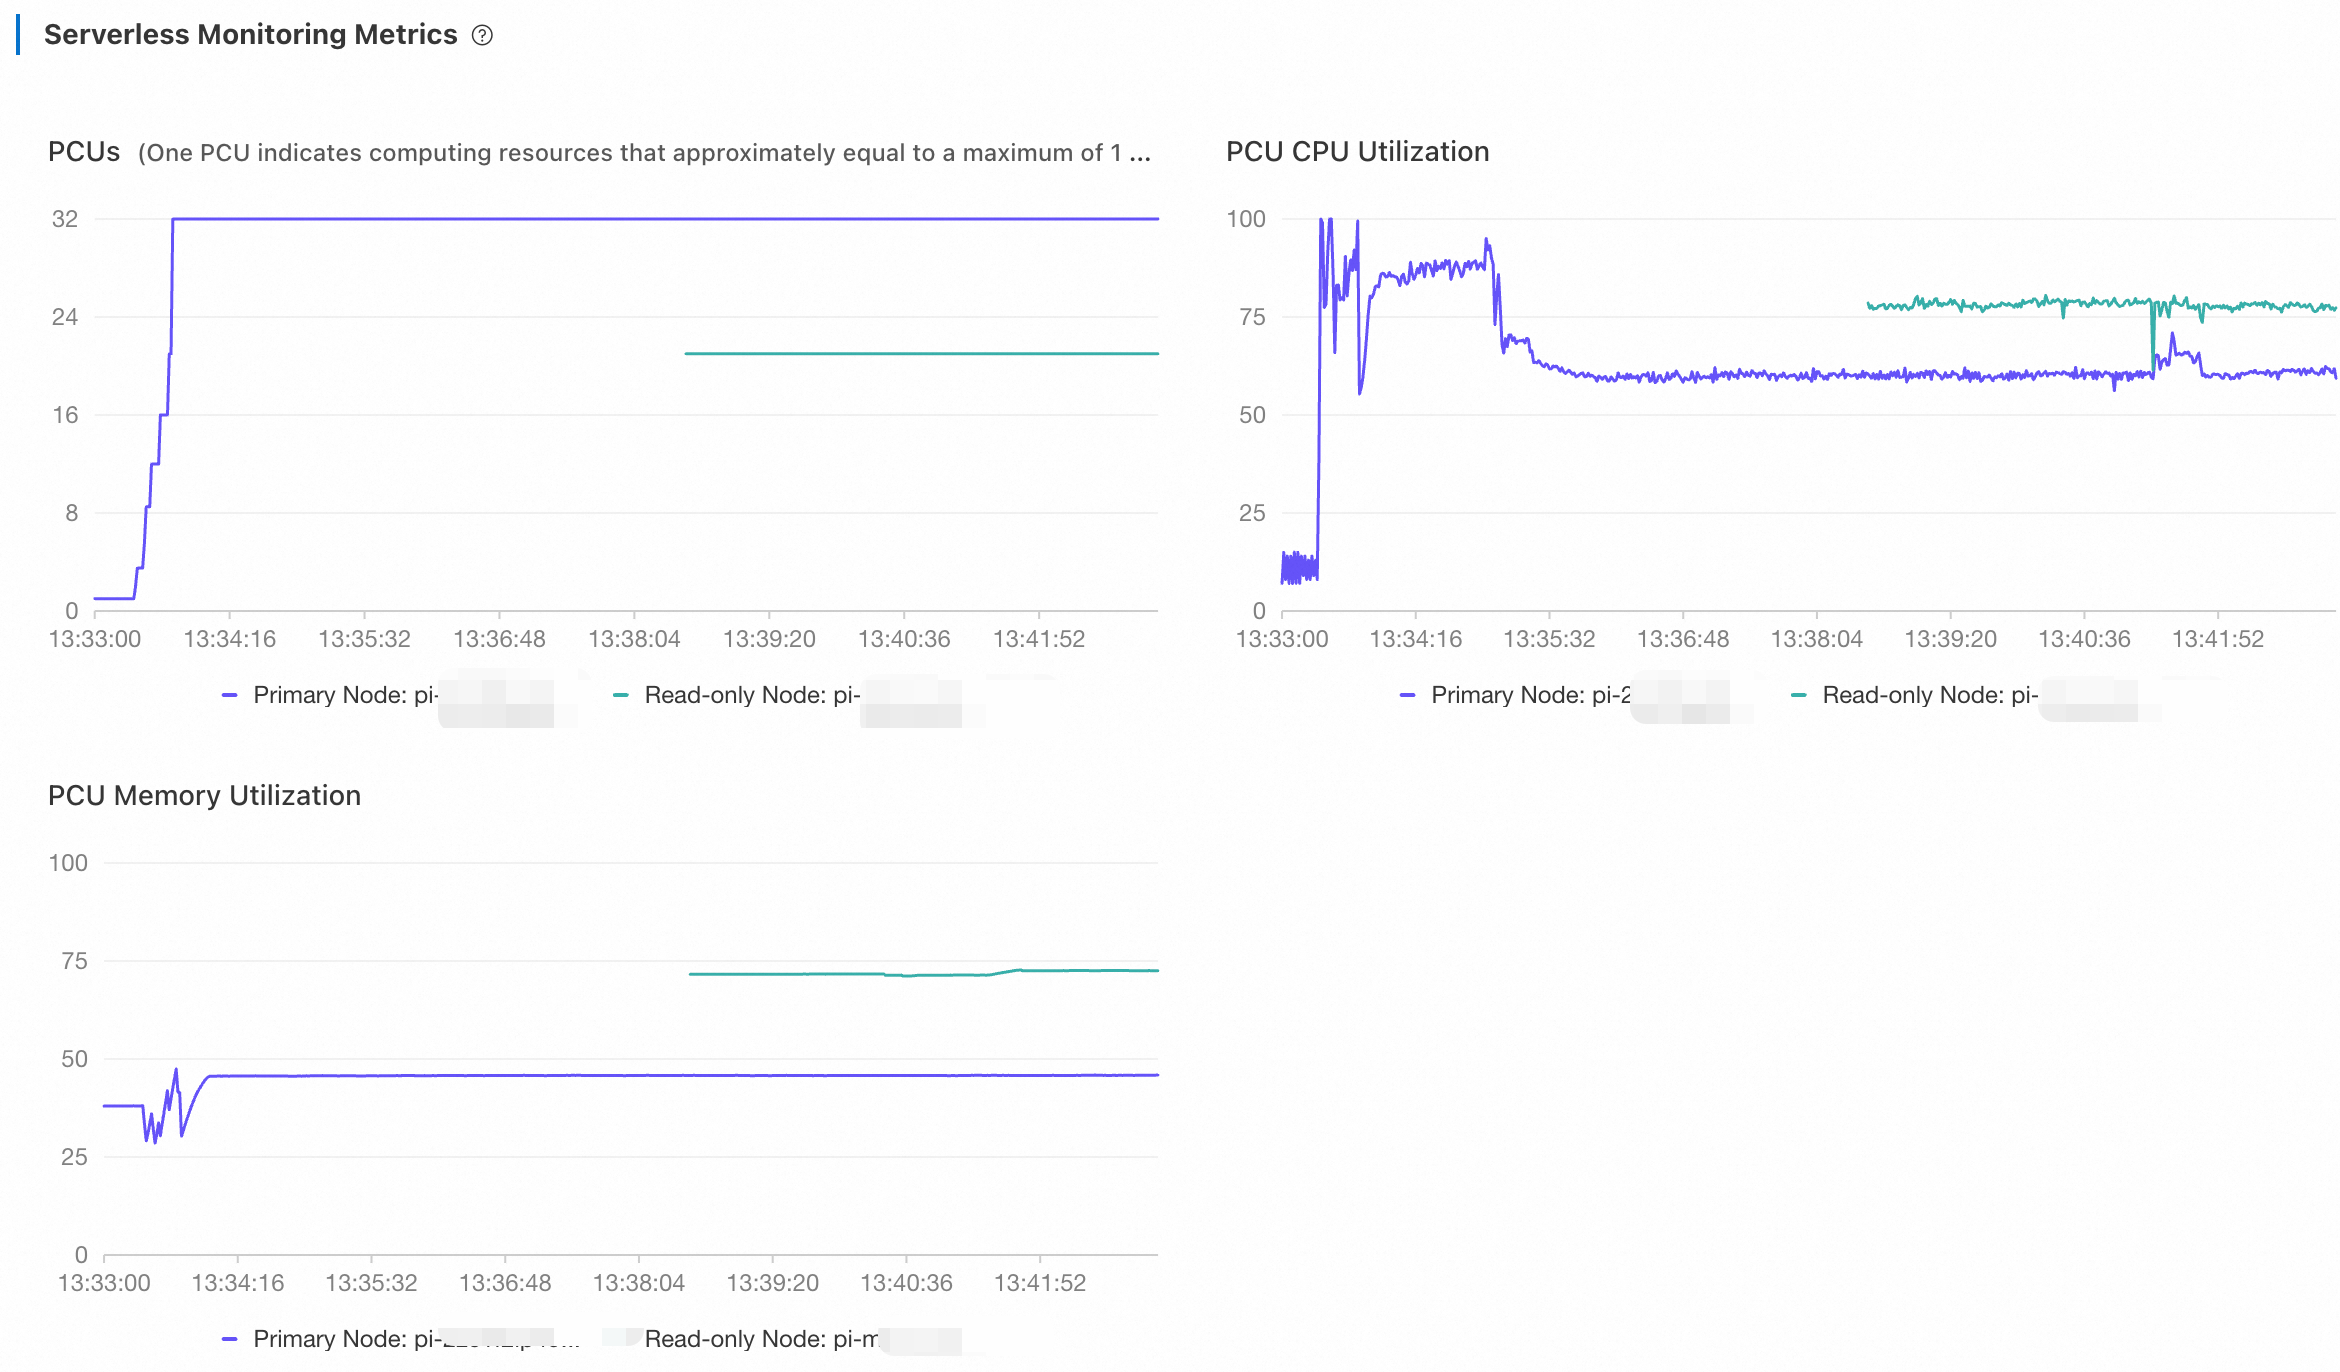
Return to the PolarDB console. On the Performance page, view the metrics of Serverless. Adjust the time range to view the monitoring information.
The primary node scaled up to 32 PCUs. After the read-only node was created to handle read loads, both the CPU utilization and the number of PCUs of the primary node dropped. As the CPU utilization of the new read-only node did not reach the 80% capacity threshold, no read-only node was added any more.
Further verification: high workloads (256 threads)
Stop the current test and double the number of threads. Set the --threads parameter to 256.
Run the following command. Set the
--threadsparameter to 256. Adjust other parameters accordingly. For more information, see Configuration parameters.sysbench /usr/share/sysbench/oltp_read_write.lua --mysql-host=<host> --mysql-port=<port> --mysql-user=<user> --mysql-password=<password> --mysql-db=<database> --tables=128 --table-size=1000000 --report-interval=1 --range_selects=1 --db-ps-mode=disable --rand-type=uniform --threads=256 --time=12000 runA while after the second test began, several read-only nodes were added.
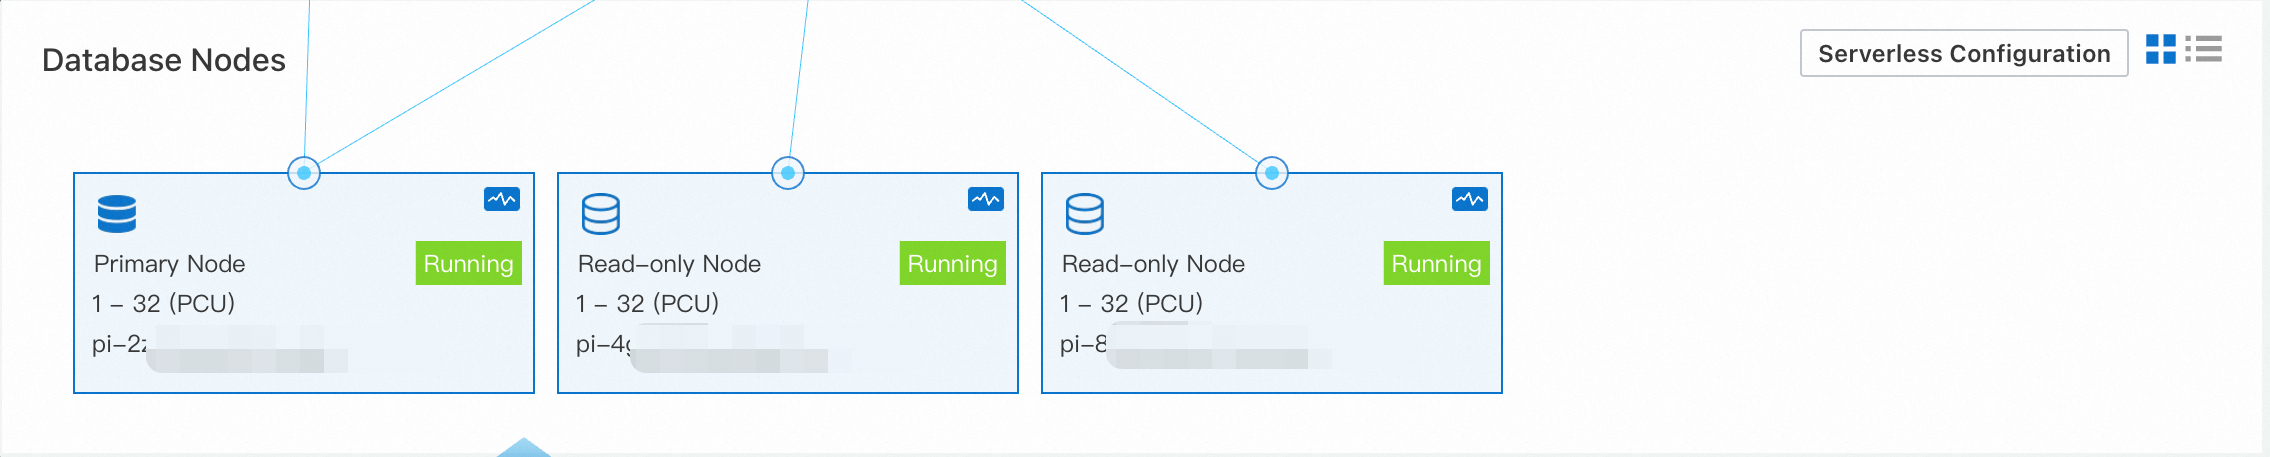
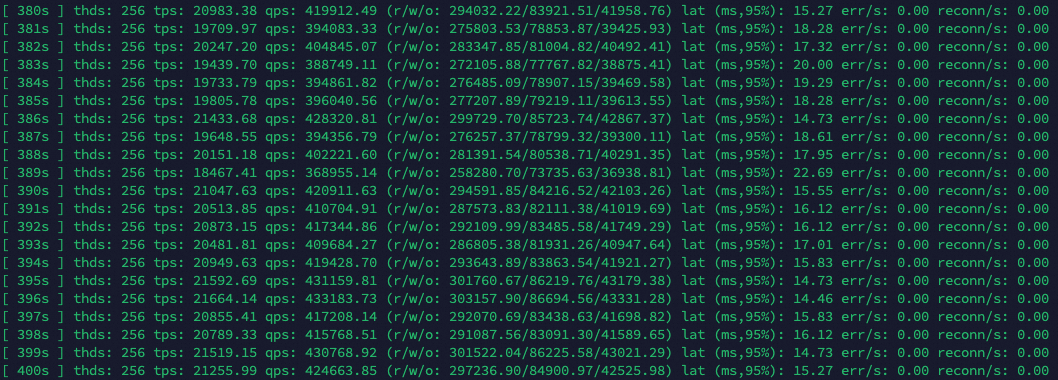
After the cluster entered the stable state, Sysbench returned output as follows: At the same stress level, this scale-out test showed slightly lower performance than the previous scale-up test, changing 170,000-190,000 from to 410,000-430,000 queries per second. Based on the QPS performance, the maximum throughput of the single-node test has been exceeded.
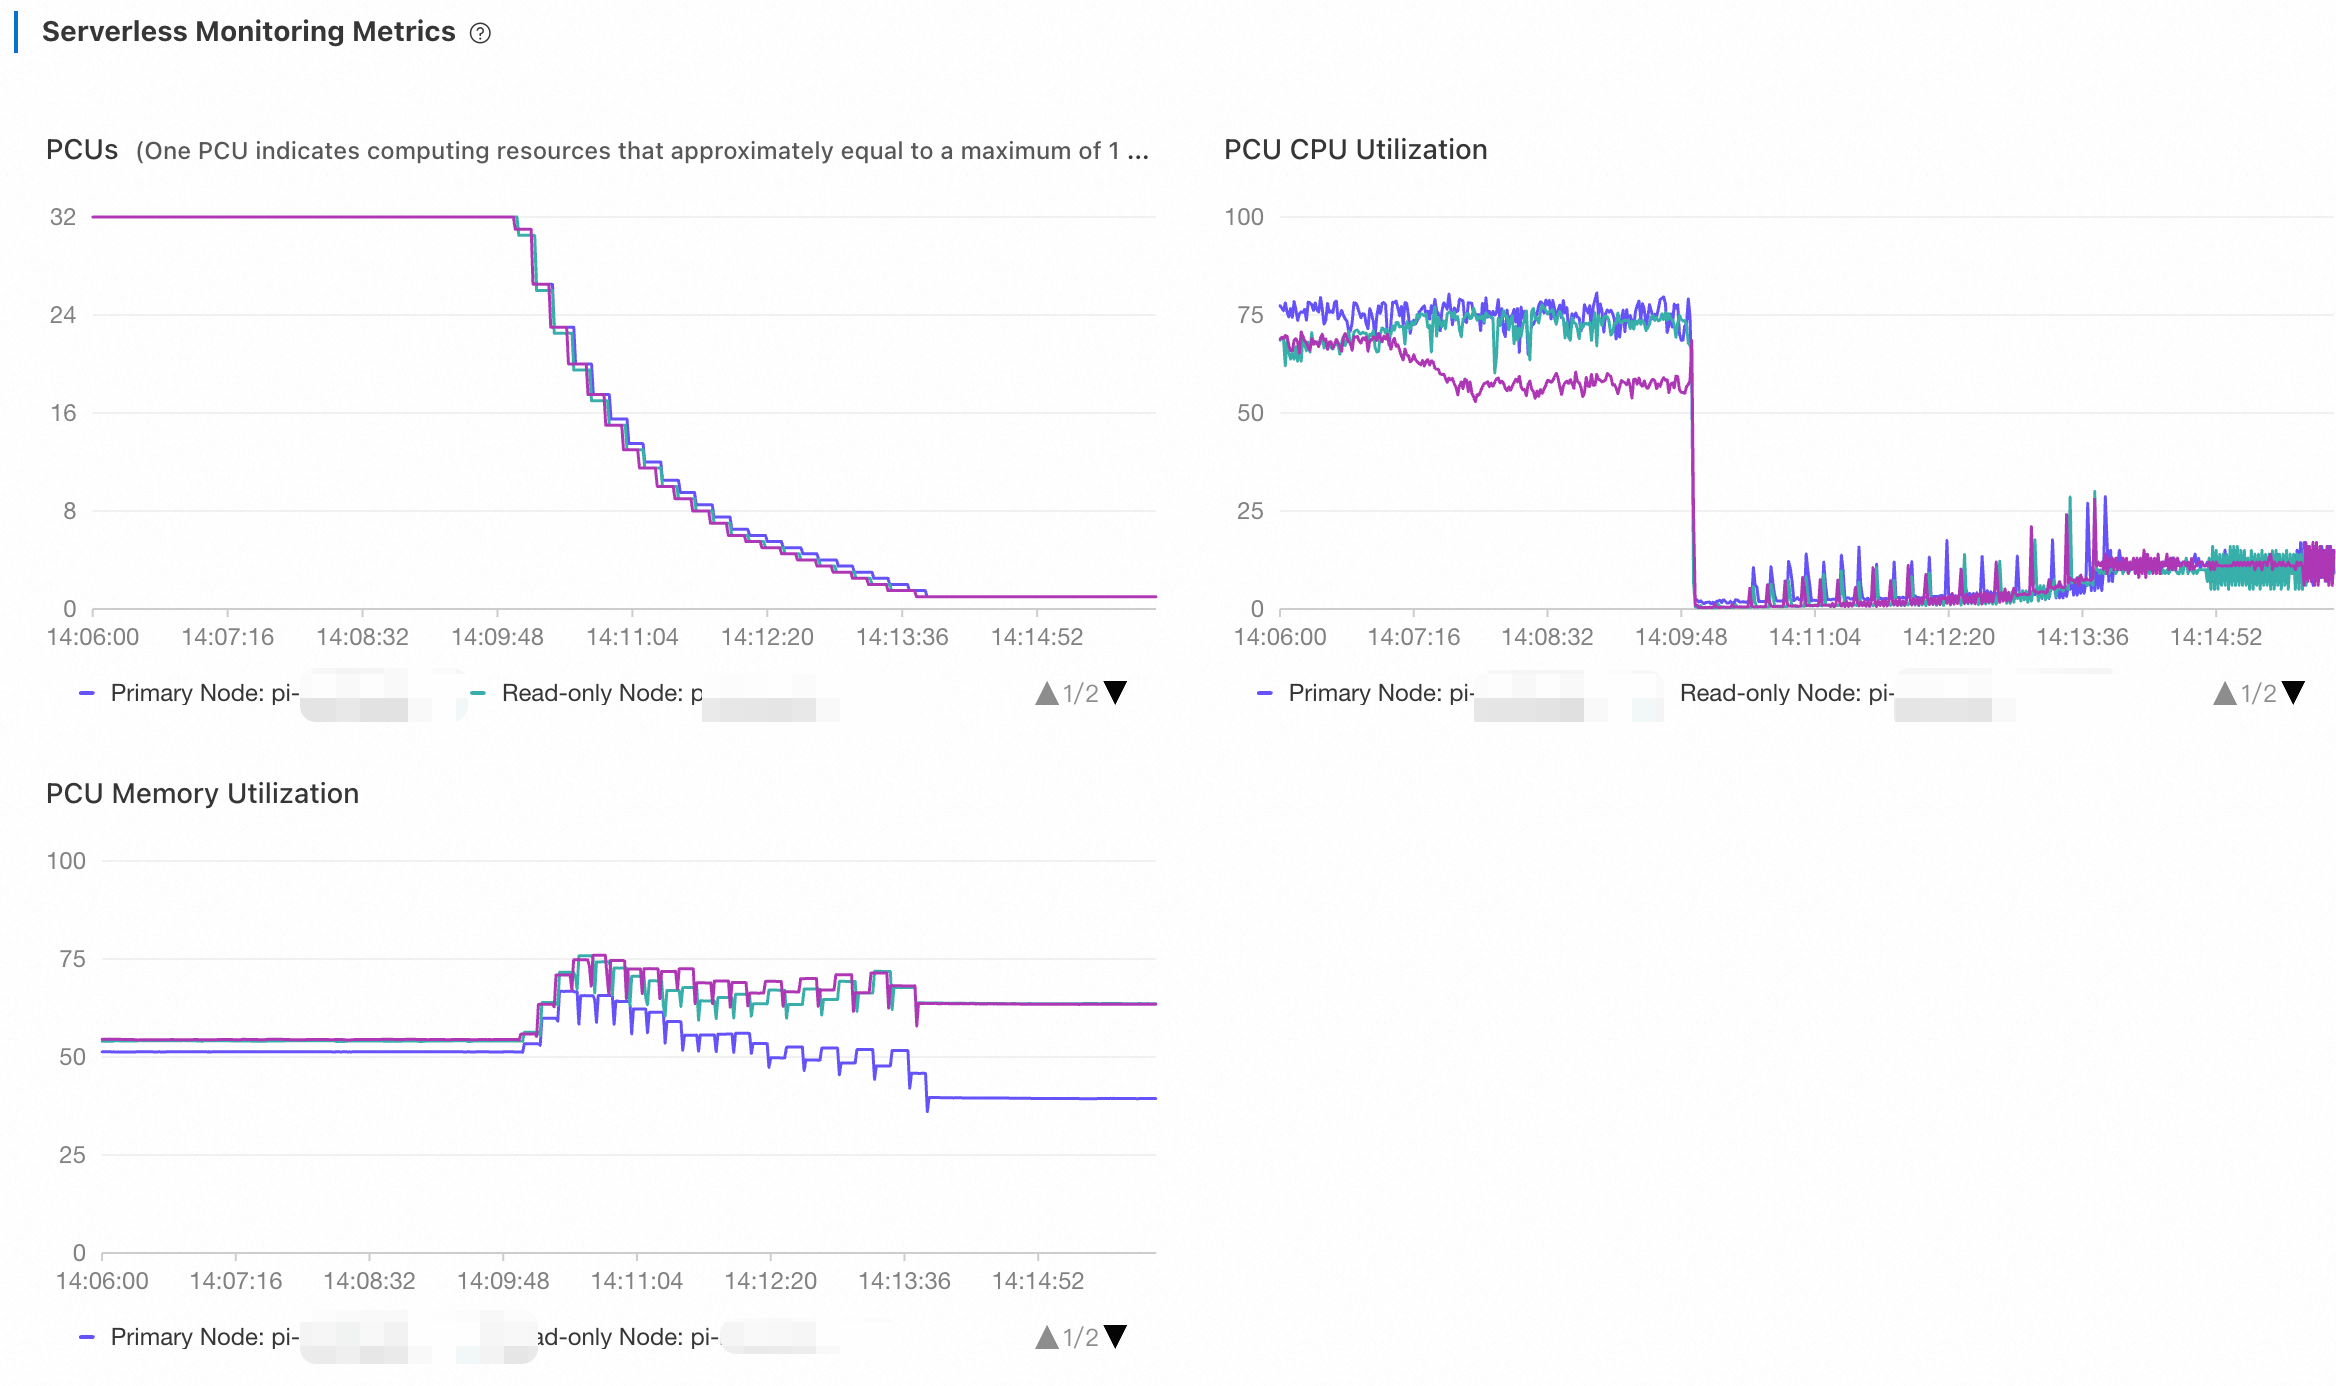
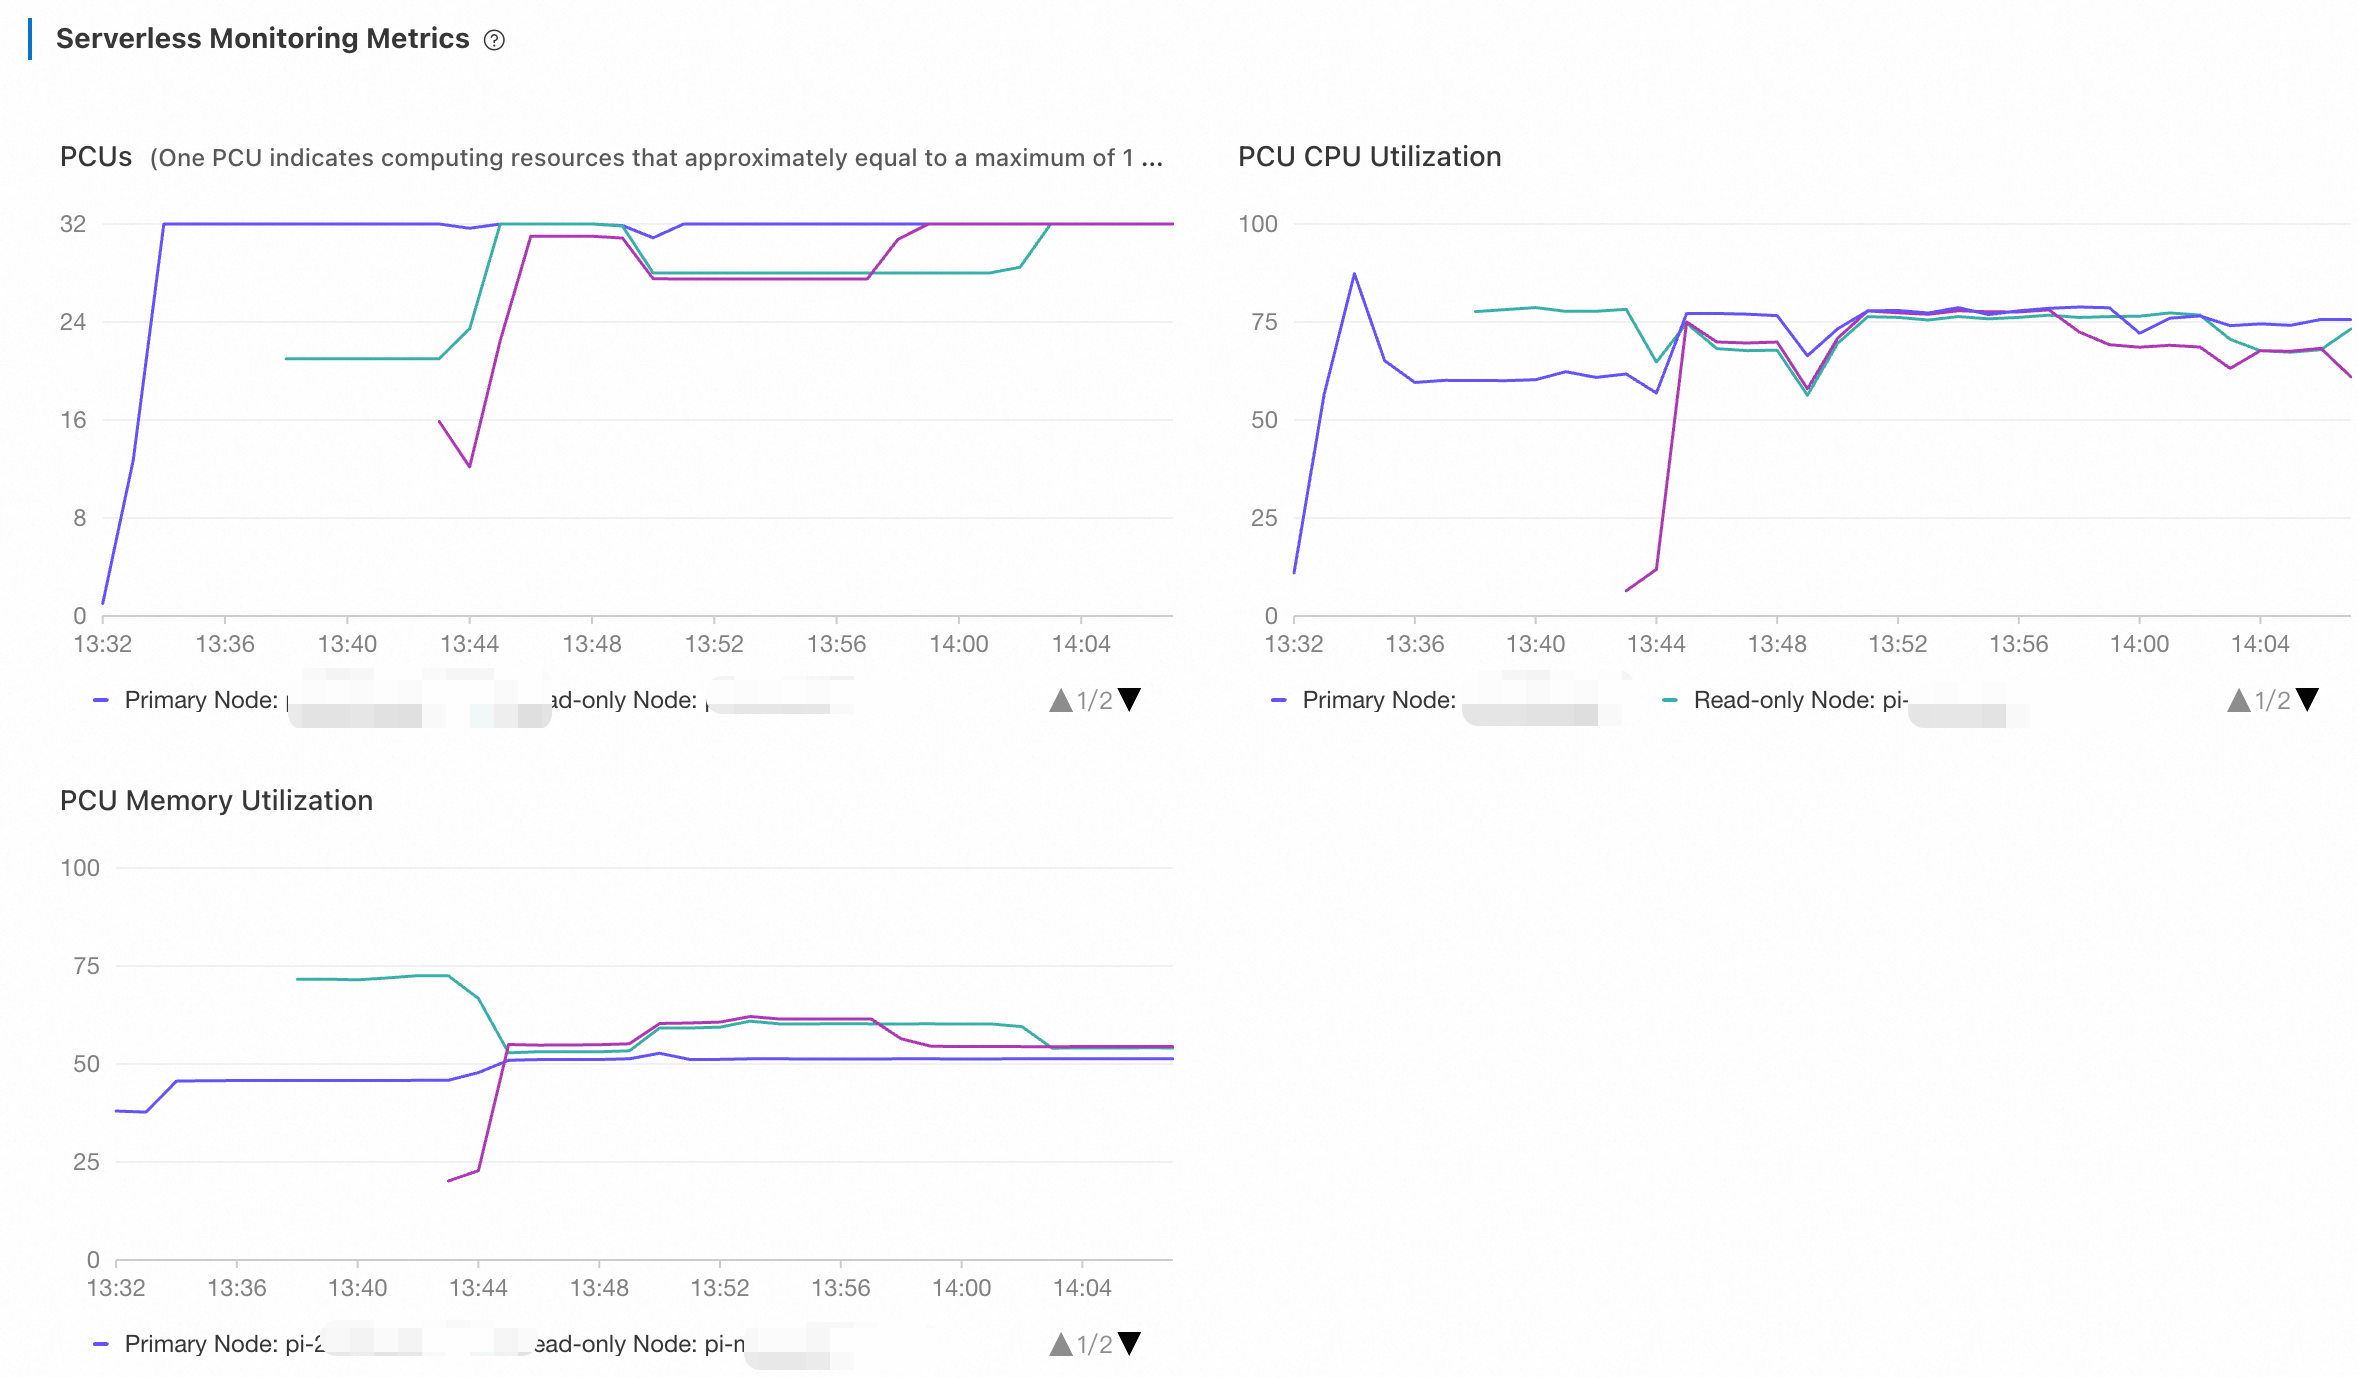
Log on to the PolarDB console. On the Performance page, view the metrics of Serverless. Adjust the time range to view the monitoring information.
The monitoring metrics figures displayed curves illustrating the performance of individual read-only nodes. After a new read-only node was added, the load on pre-existing read-only nodes gradually dropped, finally stabilizing at similar levels. This indicated that PolarProxy had distributed loads to the newly added read-only node. PolarDB Serverless employs a flexible approach to scaling to avoid frequent configuration changes. Instead of scaling out or in based on fixed thresholds, it utilizes a wide range of thresholds. Meanwhile, as the downgrade has negative impacts on cluster performance, PolarProxy cannot ensure 100% balance among nodes. In general, the first read-only nodes to scale down would end up with fewer PCUs.
After a period of time, stop the test. Adjust the time range to view the monitoring information.
About one or two minutes after the scale-out test stopped, the primary node scaled down to 1 PCU in two to three minutes. The CPU utilization of read-only nodes is instantly reduced while that of the primary node remained high for a small period of time because it had to perform
PURGE UNDOoperations.15 to 20 minutes after the test stopped, read-only nodes were released one by one. PolarDB Serverless does not immediately remove idle read-only nodes to avoid frequent configuration changes.