Performance Insight helps you evaluate database workloads and identify the root causes of performance issues in PolarDB for MySQL clusters. It integrates diagnostics capabilities from Database Autonomy Service (DAS).
How it works
Performance Insight collects and analyzes data based on the state of performance_schema on your cluster:
performance_schema state | Data source |
|---|---|
| Enabled | Data stored in performance_schema |
| Disabled | Data from active sessions |
Enable Performance Insight
Log on to the PolarDB console.
In the left-side navigation pane, click Clusters.
In the top navigation bar, select the region where your cluster is deployed.
On the Clusters page, find and click the ID of the cluster you want to manage.
In the left-side navigation pane, choose Diagnostics and Optimization > Quick Diagnostics.
Click the Performance Insight tab.
Click Enable Performance Insight.
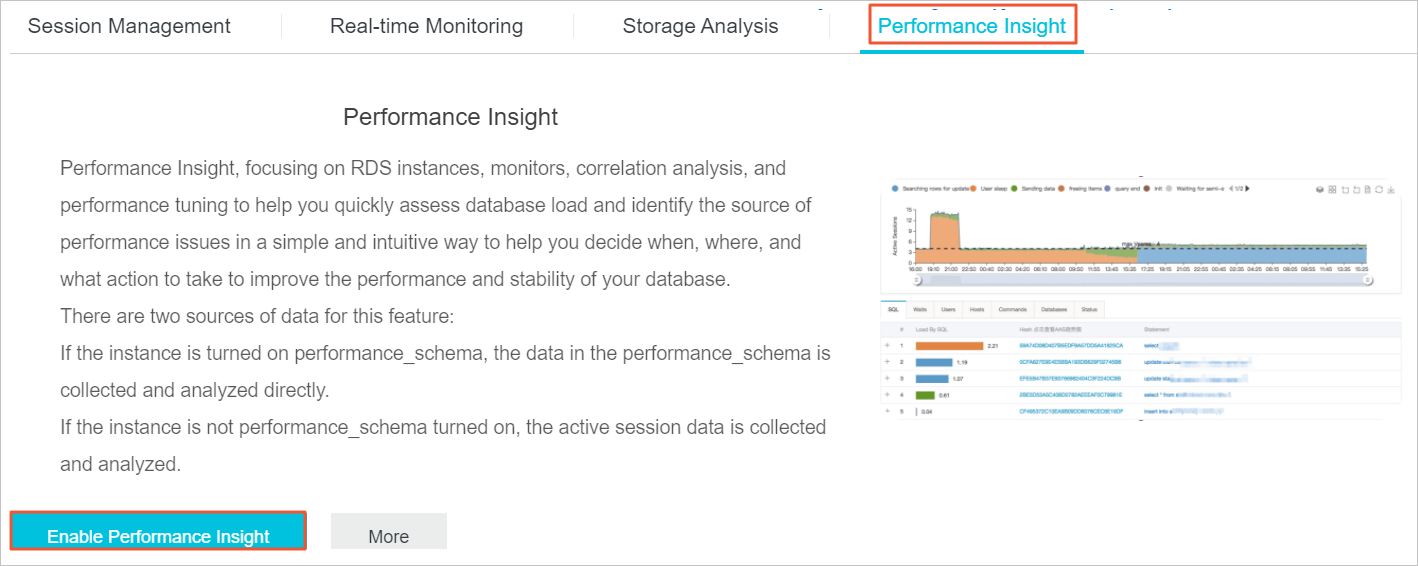
In the dialog box that appears, click Confirm.
Analyze performance data
After enabling Performance Insight, the tab displays two main sections.
Performance Trend
The Performance Trend section shows how performance metrics change over a specified time range. To inspect a specific metric such as CPU utilization in detail, click Details in the upper-right corner of that metric's section.
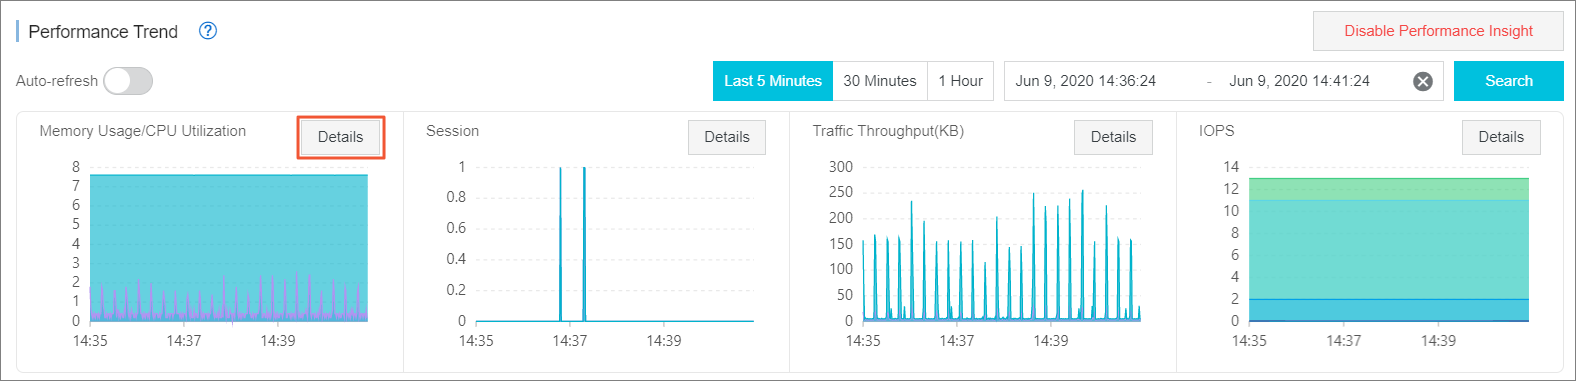
The selected time range cannot exceed seven days.
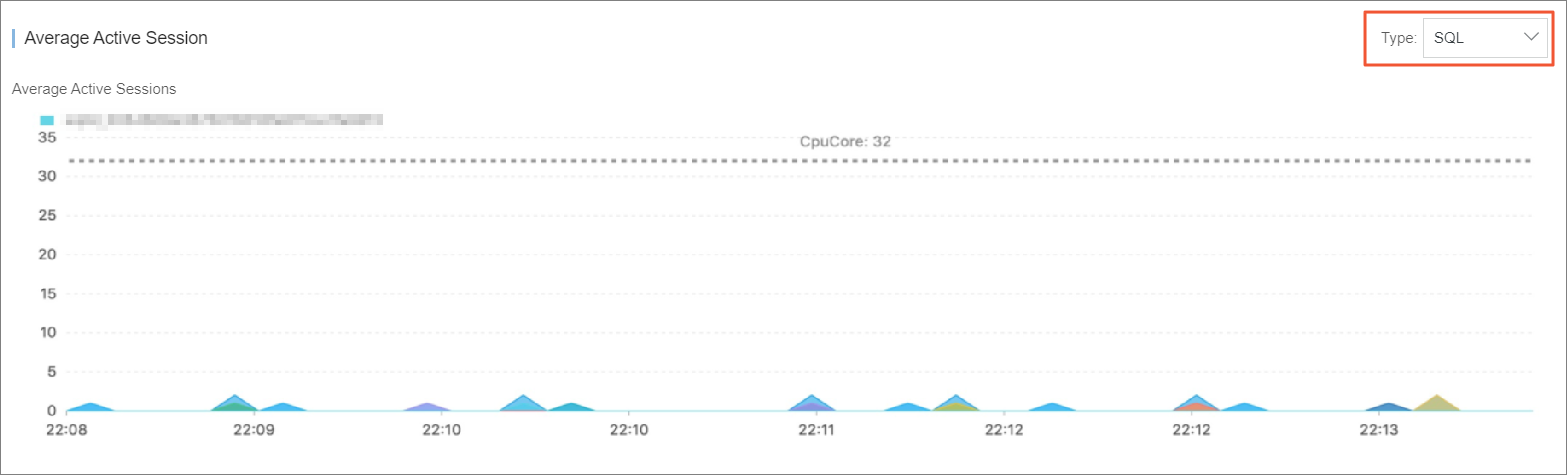
Average Active Session
The Average Active Session section shows session activity trends and lets you analyze database workloads across multiple dimensions. Use it to pinpoint the root cause of performance issues.