Performance Agent is a PolarDB for MySQL plug-in that writes node-level performance statistics to an in-memory table at a configurable interval. Query the table directly with SQL or connect it to a monitoring platform like Grafana to track CPU, memory, I/O, connections, and InnoDB engine metrics in real time.
Prerequisites
Before you begin, ensure that you have:
A PolarDB for MySQL 8.0 cluster at revision version 8.0.2.1.0 or later. To check the version, see Query the engine version.
The
loose_performance_schemaparameter set toON. To update it, see Specify cluster and node parameters.
How it works
Performance Agent collects performance data at a configurable interval and writes each snapshot as a row into the PERF_STATISTICS memory table in the performance_schema system database. The table stores the performance data that is generated over the most recent period of time.
Enabling performance_schema lets you monitor locks, transactions, and memory metrics, but it consumes a significant amount of system memory and can affect cluster performance. It is disabled by default in PolarDB for MySQL. If you enable it, configure only the metrics you need based on your cluster's specifications and available resources.
Parameters
| Parameter | Description | Default |
|---|---|---|
performance_agent_enabled | Enables or disables Performance Agent. Valid values: ON, OFF. | ON |
performance_agent_interval | How often Performance Agent collects data. Valid values: 1–60. Unit: seconds. | 1 |
performance_agent_perfstat_volume_size | Maximum number of rows in the PERF_STATISTICS table. | 3600 |
With the defaults (interval = 1, volume_size = 3600), the table retains approximately one hour of data.
To modify these parameters, see Specify cluster and node parameters.
PERF_STATISTICS table
Schema
CREATE TEMPORARY TABLE `PERF_STATISTICS` (
  `TIME` datetime NOT NULL DEFAULT '0000-00-00 00:00:00',
  `PROCS_MEM_USAGE` double NOT NULL DEFAULT '0',
  `PROCS_CPU_RATIO` double NOT NULL DEFAULT '0',
  `PROCS_IOPS` double NOT NULL DEFAULT '0',
  `PROCS_IO_READ_BYTES` bigint(21) NOT NULL DEFAULT '0',
  `PROCS_IO_WRITE_BYTES` bigint(21) NOT NULL DEFAULT '0',
  `MYSQL_CONN_ABORT` int(11) NOT NULL DEFAULT '0',
  `MYSQL_CONN_CREATED` int(11) NOT NULL DEFAULT '0',
  `MYSQL_USER_CONN_COUNT` int(11) NOT NULL DEFAULT '0',
  `MYSQL_CONN_RUNNING` int(11) NOT NULL DEFAULT '0',
  `MYSQL_LOCK_IMMEDIATE` int(11) NOT NULL DEFAULT '0',
  `MYSQL_LOCK_WAITED` int(11) NOT NULL DEFAULT '0',
  `MYSQL_COM_INSERT` int(11) NOT NULL DEFAULT '0',
  `MYSQL_COM_UPDATE` int(11) NOT NULL DEFAULT '0',
  `MYSQL_COM_DELETE` int(11) NOT NULL DEFAULT '0',
  `MYSQL_COM_SELECT` int(11) NOT NULL DEFAULT '0',
  `MYSQL_COM_COMMIT` int(11) NOT NULL DEFAULT '0',
  `MYSQL_COM_ROLLBACK` int(11) NOT NULL DEFAULT '0',
  `MYSQL_COM_PREPARE` int(11) NOT NULL DEFAULT '0',
  `MYSQL_LONG_QUERY` int(11) NOT NULL DEFAULT '0',
  `MYSQL_TCACHE_GET` bigint(21) NOT NULL DEFAULT '0',
  `MYSQL_TCACHE_MISS` bigint(21) NOT NULL DEFAULT '0',
  `MYSQL_TMPFILE_CREATED` int(11) NOT NULL DEFAULT '0',
  `MYSQL_TMP_TABLES` int(11) NOT NULL DEFAULT '0',
  `MYSQL_TMP_DISKTABLES` int(11) NOT NULL DEFAULT '0',
  `MYSQL_SORT_MERGE` int(11) NOT NULL DEFAULT '0',
  `MYSQL_SORT_ROWS` int(11) NOT NULL DEFAULT '0',
  `MYSQL_BYTES_RECEIVED` bigint(21) NOT NULL DEFAULT '0',
  `MYSQL_BYTES_SENT` bigint(21) NOT NULL DEFAULT '0',
  `MYSQL_BINLOG_OFFSET` int(11) NOT NULL DEFAULT '0',
  `MYSQL_IOLOG_OFFSET` int(11) NOT NULL DEFAULT '0',
  `MYSQL_RELAYLOG_OFFSET` int(11) NOT NULL DEFAULT '0',
  `EXTRA` json NOT NULL DEFAULT 'null'
) ENGINE=InnoDB DEFAULT CHARSET=utf8;
Column reference
Columns are grouped by functional area.
System resources
| Column | Description |
|---|---|
TIME | Timestamp of the row. Format: yyyy-MM-dd HH:mm:ss. |
PROCS_MEM_USAGE | Physical memory used by the cluster. Unit: bytes. |
PROCS_CPU_RATIO | CPU utilization. |
PROCS_IOPS | Number of I/O operations performed. |
PROCS_IO_READ_BYTES | Data read by I/O operations. Unit: bytes. |
PROCS_IO_WRITE_BYTES | Data written by I/O operations. Unit: bytes. |
Connections and sessions
| Column | Description |
|---|---|
MYSQL_CONN_ABORT | Number of closed connections. |
MYSQL_CONN_CREATED | Number of new connections. |
MYSQL_USER_CONN_COUNT | Total number of connections. |
MYSQL_CONN_RUNNING | Number of active connections. |
Locks
| Column | Description |
|---|---|
MYSQL_LOCK_IMMEDIATE | Number of locks held. |
MYSQL_LOCK_WAITED | Number of lock wait events. |
SQL statements
| Column | Description |
|---|---|
MYSQL_COM_INSERT | Number of INSERT statements executed. |
MYSQL_COM_UPDATE | Number of UPDATE statements executed. |
MYSQL_COM_DELETE | Number of DELETE statements executed. |
MYSQL_COM_SELECT | Number of SELECT statements executed. |
MYSQL_COM_COMMIT | Number of explicitly committed transactions. |
MYSQL_COM_ROLLBACK | Number of rolled-back transactions. |
MYSQL_COM_PREPARE | Number of prepared statements. |
MYSQL_LONG_QUERY | Number of slow queries. |
Cache and temporary objects
| Column | Description |
|---|---|
MYSQL_TCACHE_GET | Number of cache hits. |
MYSQL_TCACHE_MISS | Number of cache misses. |
MYSQL_TMPFILE_CREATED | Number of temporary files created. |
MYSQL_TMP_TABLES | Number of temporary tables created. |
MYSQL_TMP_DISKTABLES | Number of temporary disk tables created. |
Sort operations
| Column | Description |
|---|---|
MYSQL_SORT_MERGE | Number of times data is merged and sorted. |
MYSQL_SORT_ROWS | Number of rows sorted. |
Network and replication
| Column | Description |
|---|---|
MYSQL_BYTES_RECEIVED | Data received by the node. Unit: bytes. |
MYSQL_BYTES_SENT | Data sent by the node. Unit: bytes. |
MYSQL_BINLOG_OFFSET | Size of the binary log file generated. Unit: bytes. |
MYSQL_IOLOG_OFFSET | Size of the binary log file sent by the primary node. Unit: bytes. |
MYSQL_RELAYLOG_OFFSET | Size of the binary log file applied by the read-only node. Unit: bytes. |
InnoDB engine (EXTRA column)
The EXTRA column stores InnoDB engine statistics as a JSON object. The values are equivalent to those returned by SHOW STATUS.
Use JSON path expressions to extract individual fields:
SELECT TIME, EXTRA->'$.INNODB_ROWS_READ', EXTRA->'$.INNODB_ROWS_INSERTED'
FROM performance_schema.PERF_STATISTICS
ORDER BY TIME DESC
LIMIT 30;| Field | Description |
|---|---|
INNODB_TRX_CNT | Number of transactions. |
INNODB_DATA_READ | Data read. Unit: bytes. |
INNODB_IBUF_SIZE | Number of pages merged. |
INNODB_LOG_WAITS | Number of times InnoDB waited to write log data. |
INNODB_MAX_PURGE | Number of transactions deleted. |
INNODB_N_WAITING | Number of locks InnoDB is waiting for. |
INNODB_ROWS_READ | Number of rows read. |
INNODB_LOG_WRITES | Number of times InnoDB wrote log data. |
INNODB_IBUF_MERGES | Number of times data is merged by InnoDB. |
INNODB_DATA_WRITTEN | Data written. Unit: bytes. |
INNODB_DBLWR_WRITES | Number of doublewrite operations. |
INNODB_IBUF_SEGSIZE | Size of data inserted into the insert buffer. |
INNODB_ROWS_DELETED | Number of rows deleted. |
INNODB_ROWS_UPDATED | Number of rows updated. |
INNODB_COMMIT_TRXCNT | Number of committed transactions. |
INNODB_IBUF_FREELIST | Length of the idle list. |
INNODB_MYSQL_TRX_CNT | Number of MySQL transactions. |
INNODB_ROWS_INSERTED | Number of rows inserted. |
INNODB_ACTIVE_TRX_CNT | Number of active transactions. |
INNODB_OS_LOG_WRITTEN | Log data written to disk. Unit: bytes. |
INNODB_ACTIVE_VIEW_CNT | Number of active views. |
INNODB_RSEG_HISTORY_LEN | Length of the TRX_RSEG_HISTORY table. |
INNODB_AVG_COMMIT_TRXTIME | Average time to commit a transaction. |
INNODB_MAX_COMMIT_TRXTIME | Maximum time to commit a transaction. |
INNODB_DBLWR_PAGES_WRITTEN | Number of pages written by doublewrite operations. |
Query examples
All examples query performance_schema.PERF_STATISTICS and order results by TIME DESC.
Retrieve raw snapshots
Query CPU utilization and memory usage for the last 30 seconds:
MySQL> SELECT TIME, PROCS_MEM_USAGE, PROCS_CPU_RATIO
       FROM performance_schema.PERF_STATISTICS
       ORDER BY TIME DESC
       LIMIT 30;
+---------------------+-----------------+-----------------+
| TIME                | PROCS_MEM_USAGE | PROCS_CPU_RATIO |
+---------------------+-----------------+-----------------+
| 2020-02-27 11:15:36 |       857812992 |           18.55 |
| 2020-02-27 11:15:35 |       857808896 |           18.54 |
| 2020-02-27 11:15:34 |       857268224 |           19.64 |
| 2020-02-27 11:15:33 |       857268224 |           21.06 |
| 2020-02-27 11:15:32 |       857264128 |           20.39 |
| 2020-02-27 11:15:31 |       857272320 |           20.32 |
| 2020-02-27 11:15:30 |       857272320 |           21.35 |
| 2020-02-27 11:15:29 |       857272320 |            28.8 |
| 2020-02-27 11:15:28 |       857268224 |           29.08 |
| 2020-02-27 11:15:27 |       857268224 |           26.92 |
| 2020-02-27 11:15:26 |       857268224 |           23.84 |
| 2020-02-27 11:15:25 |       857264128 |           13.76 |
| 2020-02-27 11:15:24 |       857264128 |           15.12 |
| 2020-02-27 11:15:23 |       857264128 |           14.76 |
| 2020-02-27 11:15:22 |       857264128 |           15.38 |
| 2020-02-27 11:15:21 |       857260032 |           13.23 |
| 2020-02-27 11:15:20 |       857260032 |           12.75 |
| 2020-02-27 11:15:19 |       857260032 |           12.17 |
| 2020-02-27 11:15:18 |       857255936 |           13.22 |
| 2020-02-27 11:15:17 |       857255936 |           20.51 |
| 2020-02-27 11:15:16 |       857255936 |           28.74 |
| 2020-02-27 11:15:15 |       857251840 |           29.85 |
| 2020-02-27 11:15:14 |       857251840 |           29.31 |
| 2020-02-27 11:15:13 |       856981504 |           28.85 |
| 2020-02-27 11:15:12 |       856981504 |           29.19 |
| 2020-02-27 11:15:11 |       856977408 |           29.12 |
| 2020-02-27 11:15:10 |       856977408 |           29.32 |
| 2020-02-27 11:15:09 |       856977408 |            29.2 |
| 2020-02-27 11:15:08 |       856973312 |           29.36 |
| 2020-02-27 11:15:07 |       856973312 |           28.79 |
+---------------------+-----------------+-----------------+
30 rows in set (0.08 sec)
Query InnoDB rows read and inserted over the last 30 seconds:
MySQL> SELECT TIME, EXTRA->'$.INNODB_ROWS_READ', EXTRA->'$.INNODB_ROWS_INSERTED'
FROM performance_schema.PERF_STATISTICS
ORDER BY TIME DESC
LIMIT 30;
+---------------------+-----------------------------+---------------------------------+
| TIME | EXTRA->'$.INNODB_ROWS_READ' | EXTRA->'$.INNODB_ROWS_INSERTED' |
+---------------------+-----------------------------+---------------------------------+
| 2020-02-27 11:22:17 | 39209 | 0 |
| 2020-02-27 11:22:16 | 36098 | 0 |
| 2020-02-27 11:22:15 | 38035 | 0 |
| 2020-02-27 11:22:14 | 37384 | 0 |
| 2020-02-27 11:22:13 | 38336 | 0 |
| 2020-02-27 11:22:12 | 33946 | 0 |
| 2020-02-27 11:22:11 | 36301 | 0 |
| 2020-02-27 11:22:10 | 36835 | 0 |
| 2020-02-27 11:22:09 | 36900 | 0 |
| 2020-02-27 11:22:08 | 36402 | 0 |
| 2020-02-27 11:22:07 | 39672 | 0 |
| 2020-02-27 11:22:06 | 39316 | 0 |
| 2020-02-27 11:22:05 | 37830 | 0 |
| 2020-02-27 11:22:04 | 36396 | 0 |
| 2020-02-27 11:22:03 | 34820 | 0 |
| 2020-02-27 11:22:02 | 37350 | 0 |
| 2020-02-27 11:22:01 | 39463 | 0 |
| 2020-02-27 11:22:00 | 38419 | 0 |
| 2020-02-27 11:21:59 | 37673 | 0 |
| 2020-02-27 11:21:58 | 35117 | 0 |
| 2020-02-27 11:21:57 | 36140 | 0 |
| 2020-02-27 11:21:56 | 37592 | 0 |
| 2020-02-27 11:21:55 | 39765 | 0 |
| 2020-02-27 11:21:54 | 35553 | 0 |
| 2020-02-27 11:21:53 | 35882 | 0 |
| 2020-02-27 11:21:52 | 37061 | 0 |
| 2020-02-27 11:21:51 | 40699 | 0 |
| 2020-02-27 11:21:50 | 39608 | 0 |
| 2020-02-27 11:21:49 | 39317 | 0 |
| 2020-02-27 11:21:48 | 37413 | 0 |
+---------------------+-----------------------------+---------------------------------+
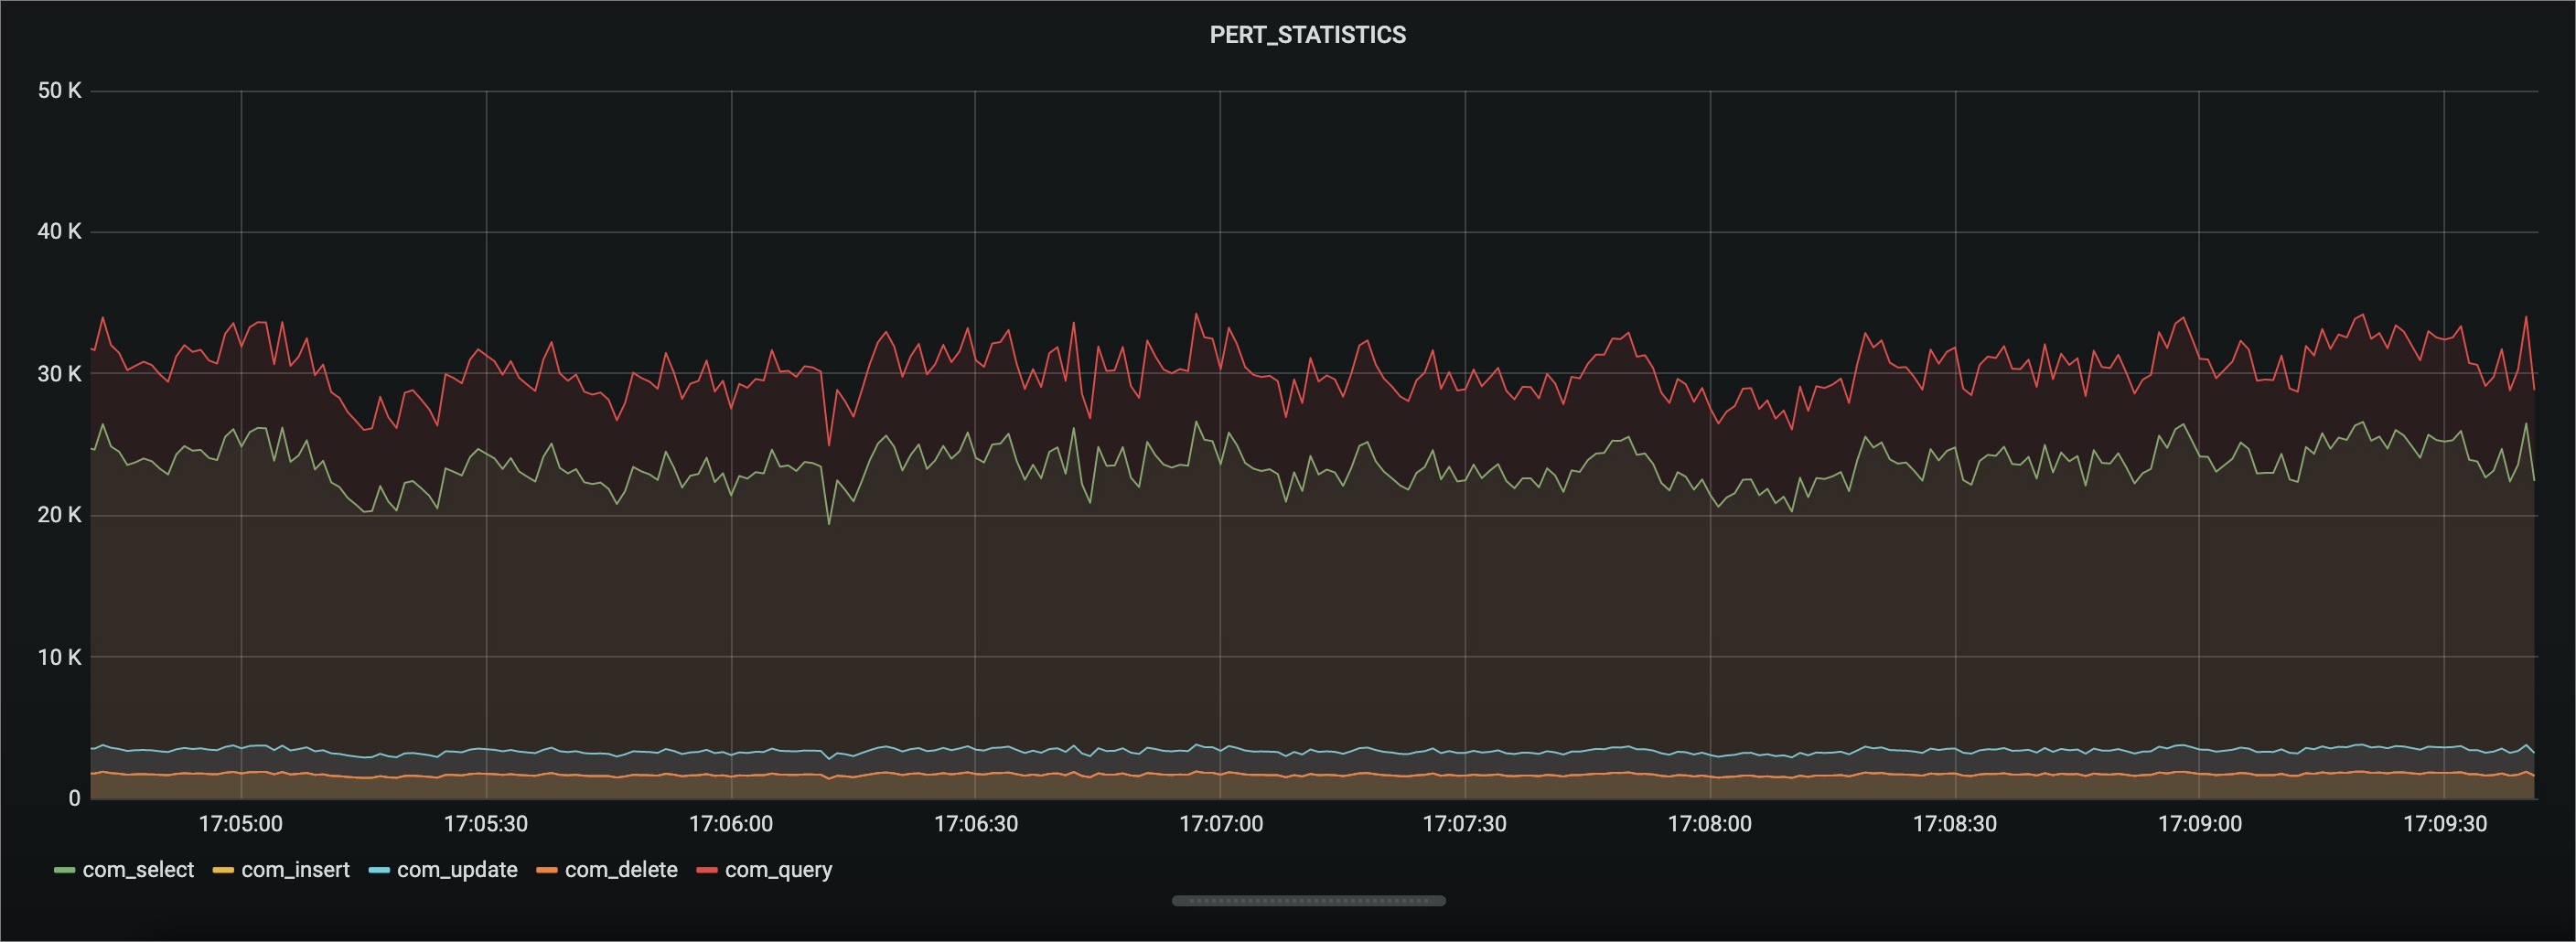
30 rows in set (0.08 sec)Connect to a monitoring platform
Connect PERF_STATISTICS to an external monitoring platform to visualize metrics over time. The screenshot below shows an example Grafana dashboard connected to PolarDB performance data.