After you enable Orca on a PolarDB for MySQL cluster, you can monitor its key/command performance directly in the PolarDB console. Use these metrics to verify that Orca is working as expected and to identify latency or throughput anomalies early.
Prerequisites
Before you begin, ensure that you have:
-
A PolarDB for MySQL cluster with Orca enabled
View Orca monitoring metrics
-
Log on to the PolarDB console. In the left navigation pane, click Clusters. Select the region where your cluster is located, then click the cluster ID to open the cluster details page.
-
In the left navigation pane, click Performance Monitoring.
-
On the Performance Monitoring page, click the Cluster or Compute Node tab, then scroll to the Orca Monitoring Metrics section.
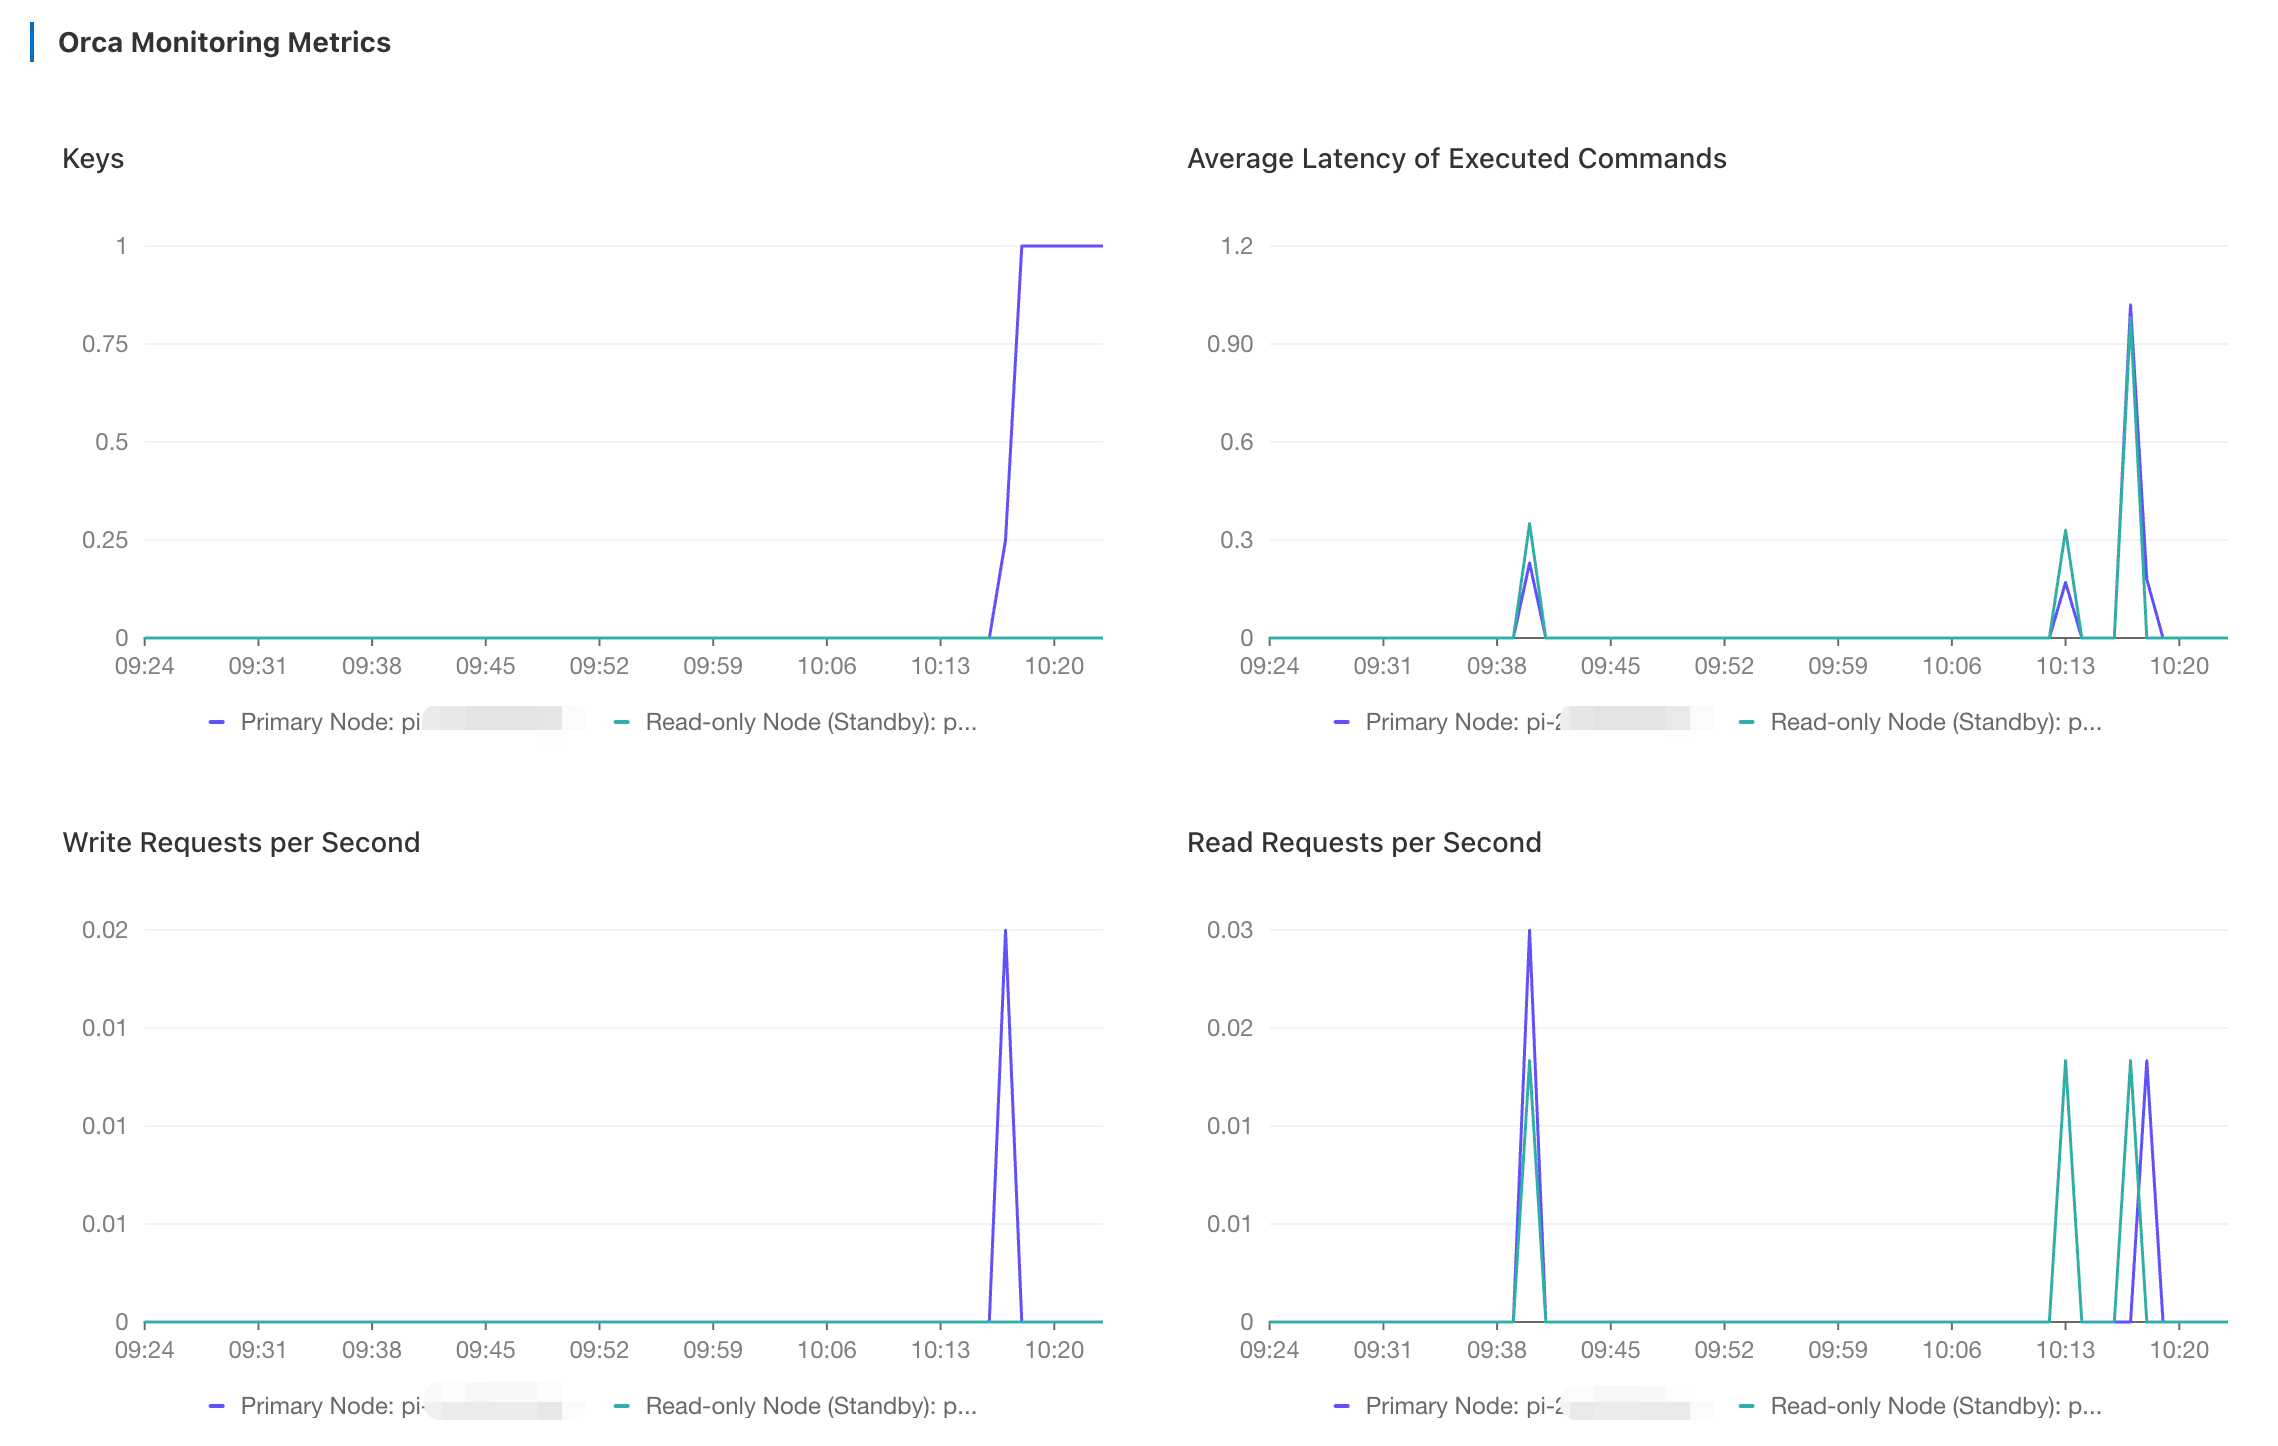
Orca monitoring metrics reference
The following table describes the four Orca monitoring metrics.
| Metric | Description | Unit |
|---|---|---|
| Keys | Total number of keys stored in the database | Count |
| Average Latency of Executed Commands | Average execution latency of commands on each node. Network latency is excluded. | Microseconds (μs) |
| Write Requests per Second | Number of write commands executed per second on each node | Count/s |
| Read Requests per Second | Number of read commands executed per second on each node | Count/s |