Resource Manager is a feature in PolarDB that allows you to monitor cluster CPU utilization and memory usage in real time. It supports two monitoring dimensions: user threads and resource groups. This allows you to understand the operational status of your system, identify sources of pressure, and distribute the load accordingly. This topic describes how to use Resource Manager.
Prerequisites
Your PolarDB cluster must run PolarDB for MySQL 8.0, and its revision version must be 8.0.2.1.0 or later.
Usage notes
- Enabling the thread pool feature results in inaccurate statistics for CPU utilization and memory usage. Therefore, you cannot enable the
resource_group_enabledandloose_thread_pool_enabledparameters at the same time. - Custom resource group configurations are not supported. All user threads are assigned to the
user_defaultresource group after a successful connection. System background threads are assigned to thesys_defaultresource group.
Parameter configuration
You can configure the following parameters for Resource Manager:
- To enable the Resource Manager monitoring feature, you must set the
resource_group_enabled,performance_schema, andcpu_usage_capture_enabledparameters to ON. - After you set the
resource_group_enabled,performance_schema, andcpu_usage_capture_enabledparameters, you must restart all nodes in the cluster for the new settings to take effect. Plan your operations accordingly and restart with caution.
| Parameter | Value | Description |
resource_group_enabled |
ON or OFF Default value: OFF |
Specifies whether to enable the resource group feature. |
performance_schema |
ON or OFF Default value: OFF |
Specifies whether to enable the Performance Schema feature. |
cpu_usage_capture_enabled |
ON or OFF Default value: OFF |
Specifies whether to enable CPU utilization collection. |
cpu_usage_capture_interval |
100 to 1000 Default value: 500 |
The CPU utilization collection interval, in milliseconds. This parameter specifies the minimum interval between consecutive sampling operations. |
cpu_usage_summarize_interval |
1000 to ULONG_MAX Default value: 2000 |
The CPU utilization summary interval, in milliseconds. This parameter specifies the time window for calculating the average CPU utilization displayed in query results. |
performance_schema_minimal |
ON or OFF Default value: OFF |
Specifies whether to minimize the memory usage of Performance Schema. Setting the performance_schema parameter to ON enables many performance-related statistics by default, which has a significant impact on performance. To reduce the performance impact of the performance_schema parameter, we recommend that you set the performance_schema_minimal parameter to ON. Note You can configure this parameter only when performance_schema is set to ON. |
Resource monitoring
- You can run the following commands to query the resource usage of threads:
call db_resource_manager.show_processlist(); call db_resource_manager.show_processlist_verbose();Note- The
show_processlistcommand aggregates the resources of parallel subthreads into the main thread, so the results do not display subthreads separately. As a result, the reported CPU utilization may exceed 100%. - The
show_processlist_verbosecommand displays subthreads separately.
mysql> call db_resource_manager.show_processlist();
+------+------+-----------------+------+---------+------+-----------+-----------+----------------+-----------+---------+-----+----------------------------------------------+
| ID   | USER | HOST            | DB   | COMMAND | TIME | STATE     | PARENT_ID | RESOURCE_GROUP | CPU_RATIO | MEM     | DOP | INFO                                         |
+------+------+-----------------+------+---------+------+-----------+-----------+----------------+-----------+---------+-----+----------------------------------------------+
|    7 | root | 127.0.0.1:47983 | test | Query   |    0 | starting  |      NULL | USR_default    | 0.00      |  455273 |   1 | call db_resource_manager.show_processlist()   |
|   12 | root | 127.0.0.1:53189 | tpch | Query   |   51 | executing |      NULL | USR_default    | 380.86    | 1238314 |   4 | select                                       |
|      |      |                 |      |         |      |           |           |                |           |         |     | l_returnflag,                                |
|      |      |                 |      |         |      |           |           |                |           |         |     | l_linestatus,                                |
|      |      |                 |      |         |      |           |           |                |           |         |     | sum(l_quantity) as sum_qty,                  |
|      |      |                 |      |         |      |           |           |                |           |         |     | sum(l                                        |
+------+------+-----------------+------+---------+------+-----------+-----------+----------------+-----------+---------+-----+----------------------------------------------+
2 rows in set (0.00 sec)

mysql> call db_resource_manager.show_processlist_verbose();
+------+------+-----------------+------+---------+------+-----------+-----------+----------------+-----------+--------+-----+----------------------------------------------+
| ID   | USER | HOST            | DB   | COMMAND | TIME | STATE     | PARENT_ID | RESOURCE_GROUP | CPU_RATIO | MEM    | DOP | INFO                                         |
+------+------+-----------------+------+---------+------+-----------+-----------+----------------+-----------+--------+-----+----------------------------------------------+
|    7 | root | 127.0.0.1:47983 | test | Query   |    0 | starting  |      NULL | USR_default    | 0.02      | 455273 |   1 | call db_resource_manager.show_processlist_verbose() |
|   12 | root | 127.0.0.1:53189 | tpch | Query   |   53 | executing |      NULL | USR_default    | 0.00      | 521446 |   4 | select                                       |
|      |      |                 |      |         |      |           |           |                |           |        |     | l_returnflag,                                |
|      |      |                 |      |         |      |           |           |                |           |        |     | l_linestatus,                                |
|      |      |                 |      |         |      |           |           |                |           |        |     | sum(l_quantity) as sum_qty,                  |
|      |      |                 |      |         |      |           |           |                |           |        |     | sum(l                                        |
|   13 | root | 127.0.0.1:53189 | tpch | Query   |   53 | executing |        12 | USR_default    | 96.71     | 192442 |   1 | NULL                                         |
|   14 | root | 127.0.0.1:53189 | tpch | Query   |   53 | executing |        12 | USR_default    | 93.13     | 185954 |   1 | NULL                                         |
|   15 | root | 127.0.0.1:53189 | tpch | Query   |   53 | executing |        12 | USR_default    | 94.73     | 183398 |   1 | NULL                                         |
|   16 | root | 127.0.0.1:53189 | tpch | Query   |   53 | executing |        12 | USR_default    | 96.73     | 196194 |   1 | NULL                                         |
+------+------+-----------------+------+---------+------+-----------+-----------+----------------+-----------+--------+-----+----------------------------------------------+
6 rows in set (0.00 sec)
You can also run the following commands to filter and sort the query results:select * from information_schema.processlist_verbose order by cpu_ratio desc limit 10; select * from information_schema.processlist_verbose where time > 60 order by mem desc - The
- You can run the following command to query all resource groups in the system and their configurations:
select * from information_schema.resource_group;Note Before you run this query, you must set theresource_group_enabledparameter to ON. For more information, see Parameter configuration.
Performance impact
Enabling the Resource Manager feature has a minor impact on the performance of a PolarDB cluster. However, because enabling performance_schema activates numerous statistics collectors by default, it can have a more significant performance impact.
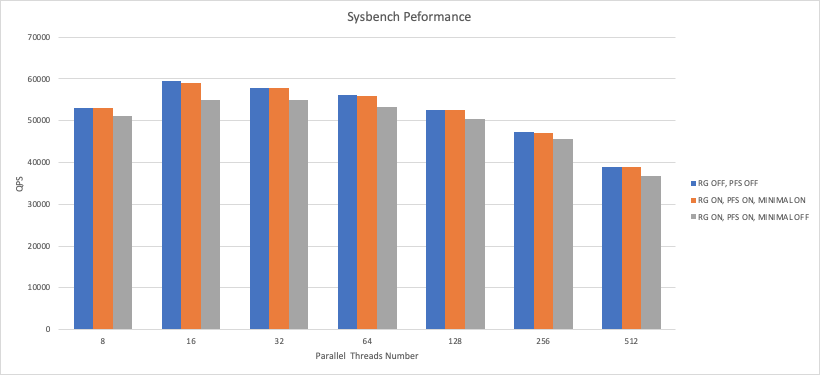
The preceding Sysbench performance tests show the following:
- Enabling Resource Manager (by setting
performance_schemaandresource_group_enabledto ) withperformance_schema_minimalset to decreases performance by approximately 8% compared to when the feature is disabled (the default setting whereperformance_schemaandresource_group_enabledare ). - Enabling Resource Manager (by setting
performance_schemaandresource_group_enabledto ) withperformance_schema_minimalset to causes a smaller performance decrease of approximately 2% compared to when the feature is disabled (the default setting whereperformance_schemaandresource_group_enabledare ).
- To reduce the performance impact of the
performance_schemaparameter, we recommend setting theperformance_schema_minimalparameter to ON. - The preceding tests were performed using Sysbench on a PolarDB for MySQL cluster with 8 cores and 32 GB of memory. The performance impact may vary depending on the instance configuration and use case.