Monitor DLC training job resource usage in real time. View CPU, GPU, memory, disk, network, RDMA, and CPFS metrics at job, pod, and GPU card levels. Configure alerts to receive notifications when thresholds are exceeded. Use CloudMonitor or ARMS for monitoring.
Limitation
Monitoring is not supported for training jobs running on general computing resources purchased with pay-as-you-go billing.
Prerequisites
For Resource Access Management (RAM) users:
-
To view monitoring data for DLC jobs in a workspace:
-
Add RAM user as workspace member with administrator, algorithm developer, or algorithm O&M engineer role. For more information, see Manage workspace members.
-
Grant RAM user read-only access permissions for CloudMonitor (AliyunCloudMonitorReadOnlyAccess). For more information, see Manage RAM user permissions.
-
-
To view monitoring data and configure alert notifications:
-
Add RAM user as workspace member with administrator, algorithm developer, or algorithm O&M engineer role. For more information, see Manage workspace members.
-
Grant RAM user management permissions for CloudMonitor (AliyunCloudMonitorFullAccess). For more information, see Manage RAM user permissions.
-
Available metrics
Available metrics include CPU, memory, disk, network, RDMA, CPFS, and GPU-related metrics (memory usage, computing power, SM device usage). Metrics are available at job, pod, and GPU card dimensions. For a complete list, see Deep Learning Containers (DLC) Metrics.
Job (task) dimension
|
Metric |
Description |
|
CPU usage (job dimension) |
CPU usage as a percentage. |
|
Memory usage (job dimension) |
Memory usage as a percentage. |
|
Disk read rate (job dimension) |
Disk read rate in MiB/s. |
|
Disk write rate (job dimension) |
Disk write rate in MiB/s. |
|
Network receive rate (job dimension) |
Network receive rate in MiB/s. |
|
Network send rate (job dimension) |
Network send rate in MiB/s. |
|
GPU computing power usage (job dimension) |
GPU computing power usage. |
|
GPU memory usage (job dimension) |
GPU memory usage. |
|
GPU SM device usage (job dimension) |
GPU SM device usage. |
|
GPU device power consumption (job dimension) |
GPU device power consumption. |
|
GPU temperature (job dimension) |
GPU temperature. |
|
Overall GPU card health (job dimension) |
Overall health of GPUs in the specified job. 100% indicates healthy GPUs. Less than 100% indicates one or more abnormal cards. |
|
RDMA receive rate (job dimension) |
RDMA receive rate. |
|
RDMA send rate (job dimension) |
RDMA send rate. |
|
CPFS write rate (job dimension) |
CPFS device write rate in MiB/s. |
|
CPFS read rate (job dimension) |
CPFS device read rate in MiB/s. |
|
NVLink received data volume (job dimension) |
Volume of data received over NVLink by GPU devices in the specified job. |
|
NVLink sent data volume (job dimension) |
Volume of data sent over NVLink by GPU devices in the specified job. |
|
PCIE received data volume (job dimension) |
Volume of data received over PCIE by GPU devices in the specified job. |
|
PCIE sent data volume (job dimension) |
Volume of data sent over PCIE by GPU devices in the specified job. |
|
For more metrics, see Deep Learning Containers (DLC) Metrics. |
|
Pod (worker) dimension
|
Metric |
Description |
|
CPU usage (pod dimension) |
CPU usage as a percentage. |
|
Memory usage (pod dimension) |
Memory usage as a percentage. |
|
Disk read rate (pod dimension) |
Disk read rate in MiB/s. |
|
Disk write rate (pod dimension) |
Disk write rate in MiB/s. |
|
Network receive rate (pod dimension) |
Network receive rate in MiB/s. |
|
Network send rate (pod dimension) |
Network send rate in MiB/s. |
|
GPU computing power usage (pod dimension) |
GPU computing power usage. |
|
GPU memory usage (pod dimension) |
GPU memory usage. |
|
GPU SM device usage (pod dimension) |
GPU SM device usage. |
|
GPU device power consumption (pod dimension) |
GPU device power consumption. |
|
GPU temperature (pod dimension) |
GPU temperature. |
|
Overall GPU card health (pod dimension) |
Overall health of GPUs in the specified pod. 100% indicates healthy GPUs. Less than 100% indicates one or more abnormal cards. |
|
RDMA receive rate (pod dimension) |
RDMA receive rate in MiB/s. |
|
RDMA send rate (pod dimension) |
RDMA send rate in MiB/s. |
|
CPFS read rate (pod dimension) |
CPFS device read rate in MiB/s. |
|
CPFS write rate (pod dimension) |
CPFS device write rate in MiB/s. |
|
NVLink received data volume (pod dimension) |
The volume of data received over NVLink by the GPU devices in the specified pod. |
|
NVLink sent data volume (pod dimension) |
The volume of data sent over NVLink by the GPU devices in the specified pod. |
|
PCIE received data volume (pod dimension) |
The volume of data received over PCIE by the GPU devices in the specified pod. |
|
PCIE sent data volume (pod dimension) |
The volume of data sent over PCIE by the GPU devices in the specified pod. |
|
For more metrics, see Deep Learning Containers (DLC) Metrics. |
|
Single GPU card dimension
|
Metric |
Description |
|
GPU memory device interface usage (card dimension) |
The GPU memory device interface usage for one or more cards in the specified pod. |
|
GPU SM device usage (card dimension) |
The GPU SM device usage of one or more cards in the specified pod. |
|
GPU device power consumption (card dimension) |
The GPU device power consumption of one or more cards in the specified pod. |
|
GPU temperature (card dimension) |
The GPU device temperature of one or more cards in the specified pod. |
|
Overall GPU card health (card dimension) |
Overall health of one or more GPU cards in the specified pod. 100% indicates healthy GPUs. Less than 100% indicates one or more abnormal cards. |
|
For more metrics, see Deep Learning Containers (DLC) Metrics. |
|
Monitor with CloudMonitor
CloudMonitor provides enterprise-grade monitoring for Alibaba Cloud resources and internet applications. View PAI-DLC job monitoring data, configure alerts, and subscribe to metrics via APIs to build custom dashboards. For more information, see What is CloudMonitor?.
Billing
CloudMonitor incurs fees. For more information, see CloudMonitor billing.
View monitoring data
-
Log on to the Cloud Monitor console.
-
In the left-side navigation pane, choose .
-
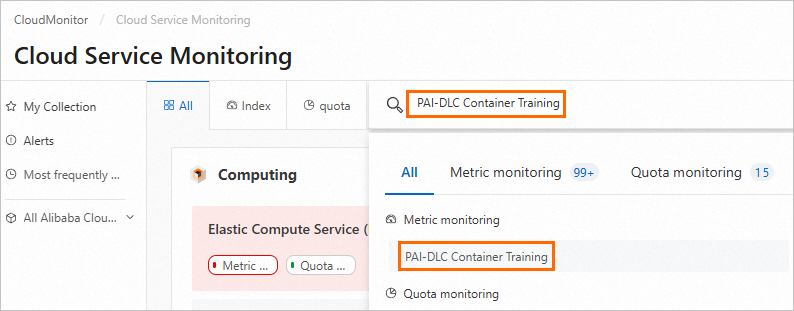
On Cloud Service Dashboard page, select PAI-Deep Learning Containers (DLC), then select or search for a Workspace ID to view monitoring charts. For workspace ID lookup, see Manage workspaces.
 Operations available on monitoring charts:
-
Switch monitoring dimensions: View metrics at job, pod, or GPU levels.
-
Click Job Dimension tab. Select or enter a DLC job ID to view monitoring data for a specific job.

-
Click POD Dimension tab. Select or enter a pod ID to view monitoring data for a specific pod.

-
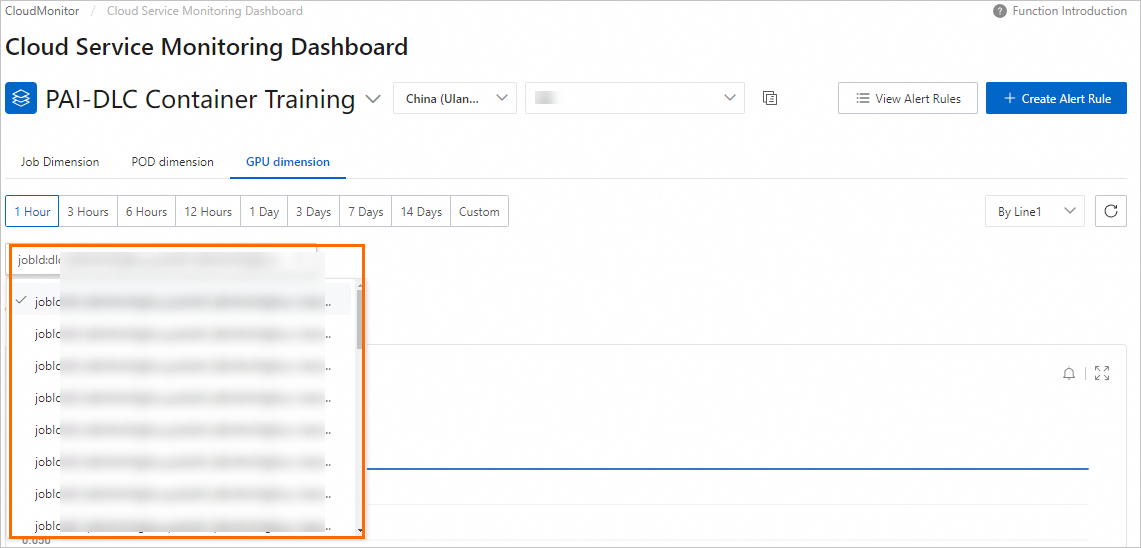
Click GPU Dimension tab. Select or enter a pod ID to view GPU-specific monitoring data for a pod in the specified DLC job.
-
-
Switch the time range:

-
Zoom in: Click zoom-in button
 in upper-right corner of each chart to view monitoring data details.
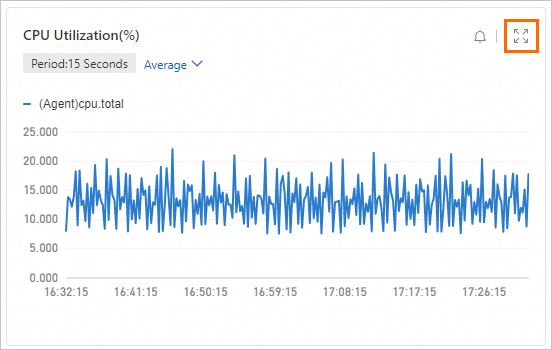
-
Configure alerts
Configure alert rules to monitor DLC job resource usage and receive notifications when thresholds are exceeded. Configure alerts via CloudMonitor console or APIs.
Configure alert contacts
-
Log on to the Cloud Monitor console.
In the navigation pane on the left, choose .
On the Alert Contacts tab, click Create Contact. Enter the name, mobile phone number, email address, or webhook URL of the alert contact, and click OK.
On the Alert Contact Group tab, click Create Contact Group. Enter a name for the alert contact group and select existing alert contacts. Then, click OK.
Configure alert rules
-
In navigation pane on left of CloudMonitor console, choose .
-
On Cloud Service Monitoring page, search for and go to PAI-Deep Learning Containers (DLC).
-
On PAI-Deep Learning Containers (DLC) page, select the region where the service is deployed and click Create Alert Rule.
-
In Create Alert Rule panel, configure the parameters and click Confirm.
Parameter
Description
Product
Product managed by CloudMonitor. Select PAI-Deep Learning Containers (DLC).
Applicable Scope
Alert rule scope. Supports All Resources and Instance.
-
All Resources: Alert sent if any DLC resource meets the alert rule.
-
Instance: Add required workspaces to Associated Instance. Alert sent only when a DLC job in an added workspace meets the alert rule.
Rule Description
Alert rule conditions. Alert triggers when monitoring data meets specified conditions. For more information, see Create an alert rule.
Mute period
Interval for repeated alert notifications if the alert remains unresolved.
Effective Period
Period when alert rule is active. Rule checks for alerts only during this period.
Tag
Custom tags for alert rule. A tag consists of a key and a value.
Alert Contact Group
Alert contact group to receive notifications. Select a contact group with alert contacts configured.
-
-
On PAI-Deep Learning Containers (DLC) page, click View Alert Rules to view details and alert history. Modify rules as needed.
Call APIs to configure alert services, including viewing alert history, managing alert templates, and configuring alert rules and contacts. For more information, see CloudMonitor API Reference: Alert Service.
Subscribe to metrics
Call CloudMonitor APIs to subscribe to DLC monitoring metrics and build custom monitoring systems and dashboards. For more information, see Cloud Service Monitoring API Reference.
|
CloudMonitor API |
Description |
|
Query the latest monitoring data of a specified metric. |
|
|
Query monitoring data of a specified metric for a specified cloud service. |
|
|
Query monitoring data of a metric for a specified cloud service. |
|
|
Query metric details available in CloudMonitor. |
|
|
Query cloud services that support time series metrics in CloudMonitor. |
|
|
Query the latest monitoring data of a specified metric for a cloud service, then query sorted monitoring data. |
This example uses the DescribeMetricList API to query monitoring data for a specified PAI-DLC metric.
-
Go to the Deep Learning Containers (DLC) Metrics page.
-
On the metrics page, find the target metric and click Get Metric Data in the Actions column.

-
On the OpenAPI Explorer page, configure key parameters and use defaults for others. For parameter details, see DescribeMetricList.
Parameter
Description
Namespace
Set this parameter to acs_pai_dlc.
MetricName
Set to the corresponding monitoring metric, for example, CARD_GPU_DRAM_ACTIVE_UTIL.
StartTime
Start time, for example, 2024-05-15 00:00:00.
EndTime
End time, for example, 2024-05-28 00:00:00.
NoteInterval between StartTime and EndTime must not exceed 31 days.
-
After configuring parameters, click Initiate Call to view monitoring data for the specified time range.
Monitor with ARMS
ARMS is an Alibaba Cloud observability platform. Customize Grafana dashboards for PAI-DLC distributed training and configure Prometheus alert rules for detailed job metric monitoring. For more information, see Application Real-Time Monitoring Service (ARMS).
Billing
ARMS incurs fees. For more information, see ARMS billing.
Ingest monitoring data
Follow these steps to ingest monitoring data:
-
Log on to ARMS console. In navigation pane, click Integration Center.
-
On Integration Center page, click Artificial Intelligence tab, then click Alibaba Cloud PAI-DLC Distributed Training Service.

-
In Start Provisioning tab, select a Data Storage Region, specify an Integration Name, then click Confirm.
Provisioning takes 1 to 2 minutes. Select the Effect Preview, Collected Metrics, or Alert Rule Templates tabs to view dashboard, metrics, and alert templates.
-
After installation, click Provisioning to view environment details.
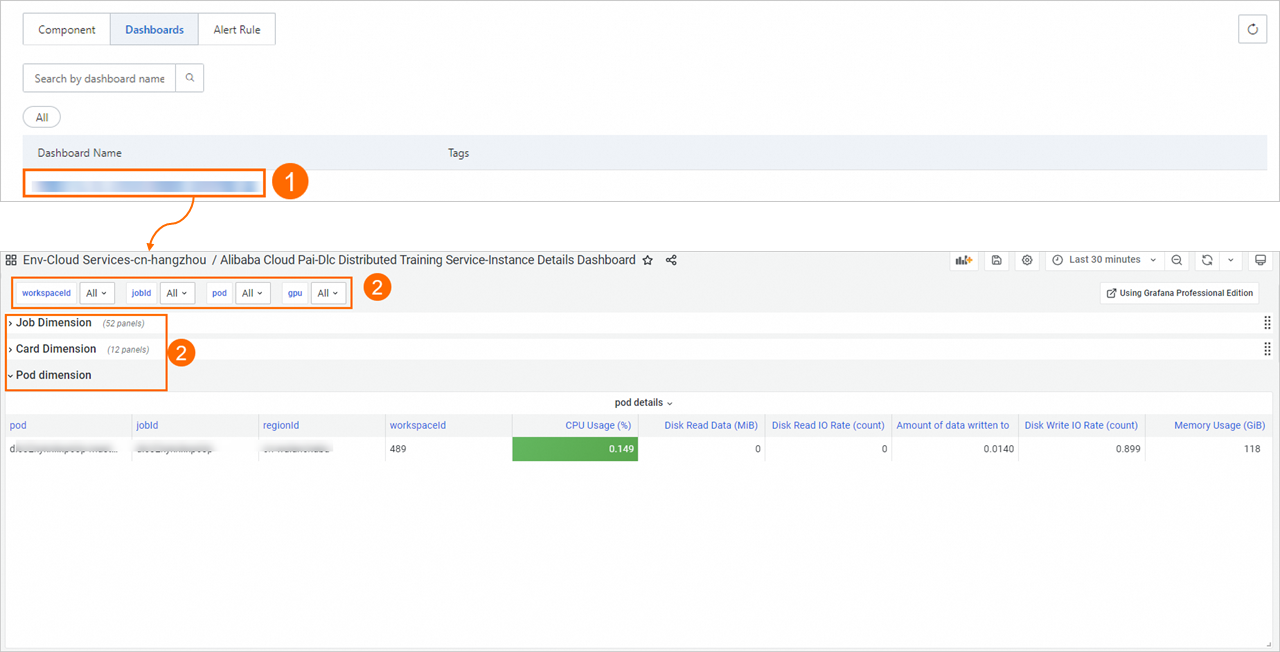
View Grafana dashboard
-
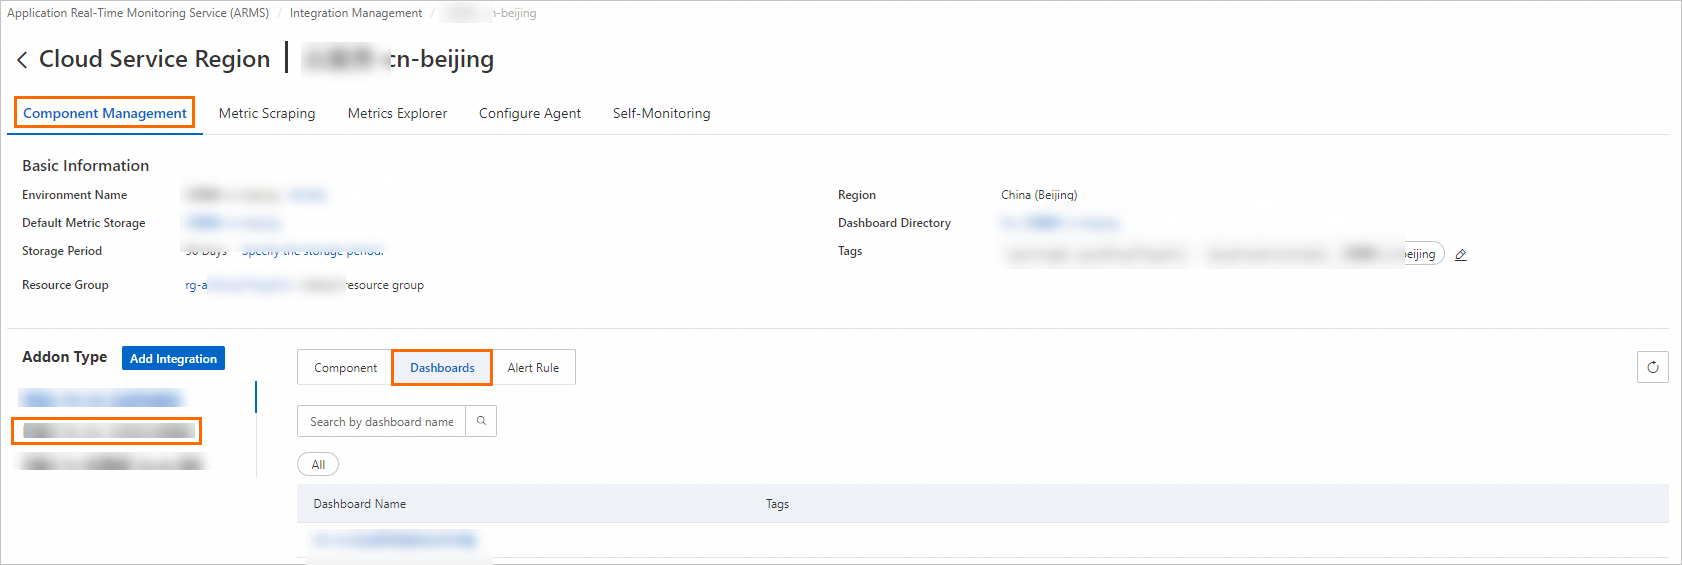
Log on to ARMS console. In navigation pane on left, choose Provisioning. On Provisioned Environments > Cloud Service Region Environment tab, click the environment name.
-
On Component Management tab, in Component Type area, select Alibaba Cloud PAI-DLC Distributed Training Service and click Dashboards to view built-in Grafana dashboards.
-
Click a dashboard name to view monitoring dashboard.
Configure Prometheus alerts
To configure Prometheus alerts:
-
Log on to ARMS console. In navigation pane on left, choose Provisioning. On Provisioned Environments > Cloud Service Region Environment tab, click the environment name.
-
In Component Type list of Component Management tab, select Alibaba Cloud PAI-DLC Distributed Training Service and click Alert Rules to view built-in alert rules.
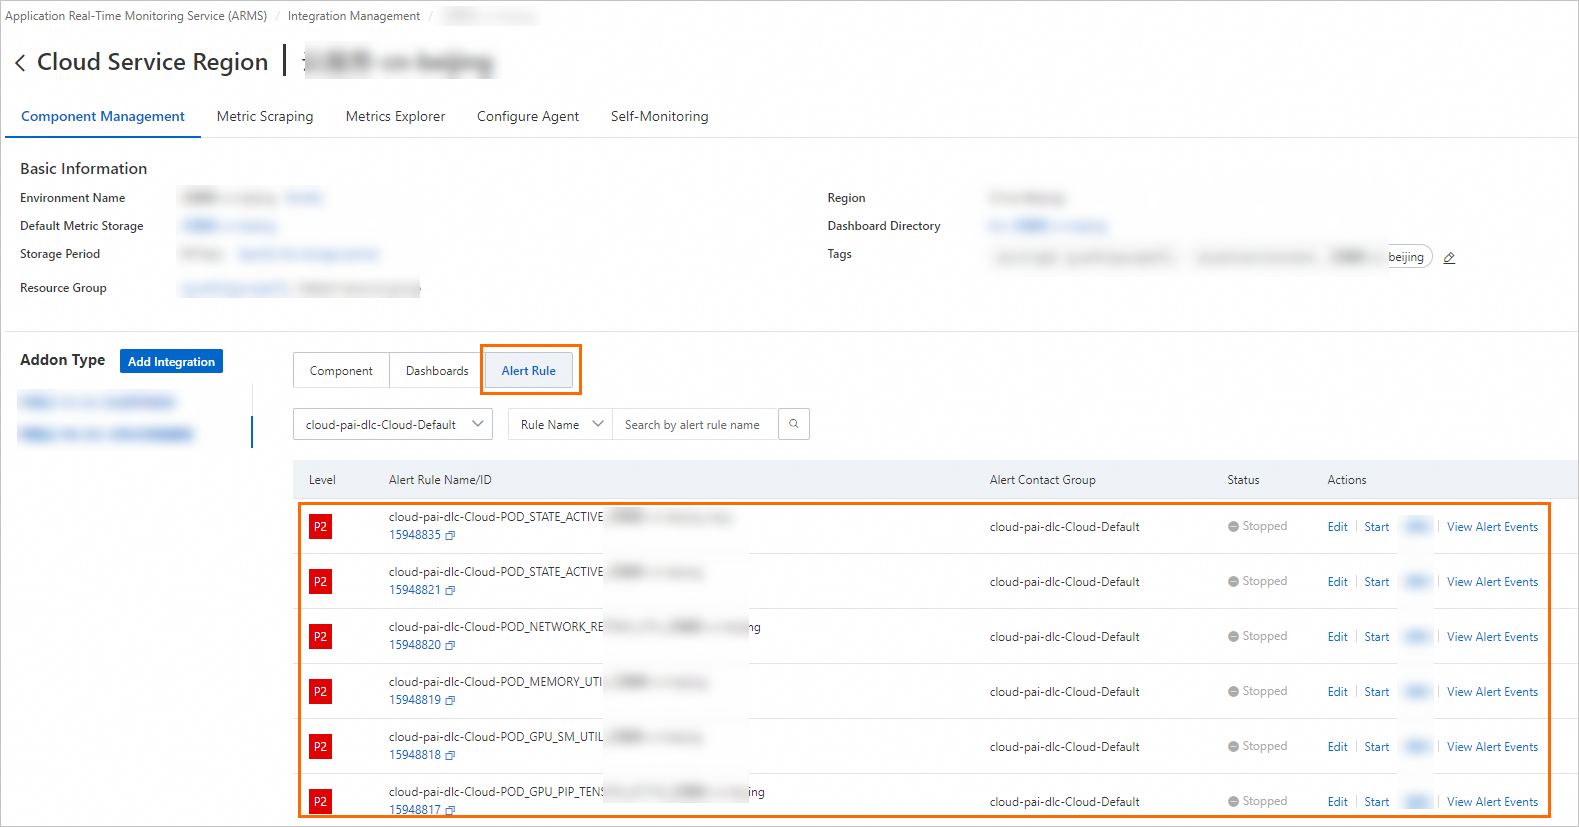
-
Built-in alert rules generate events but do not send notifications. To send notifications via email or other platforms, use one of these methods:
-
Set a notification policy to create matching rules for alert events. When a rule is triggered, the system sends alerts to specified recipients using specified methods. For more information, see Notification policies.
-
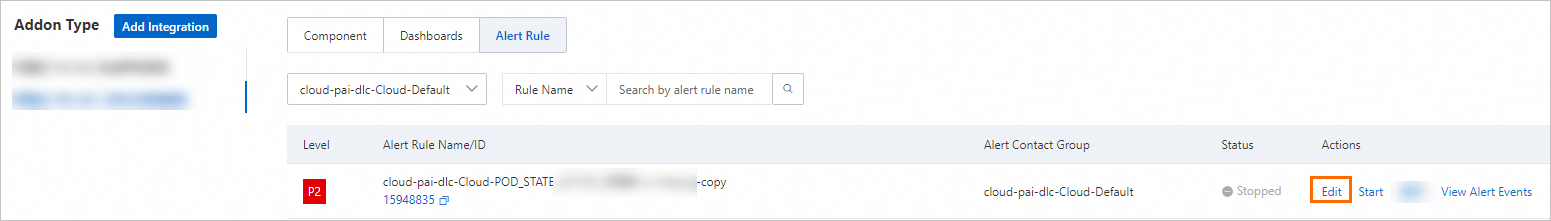
Edit the alert rule to configure a notification method.
 On the Prometheus alert rule editing page, customize alert conditions, duration, content, and notifications. For more information, see Create a Prometheus alert rule.
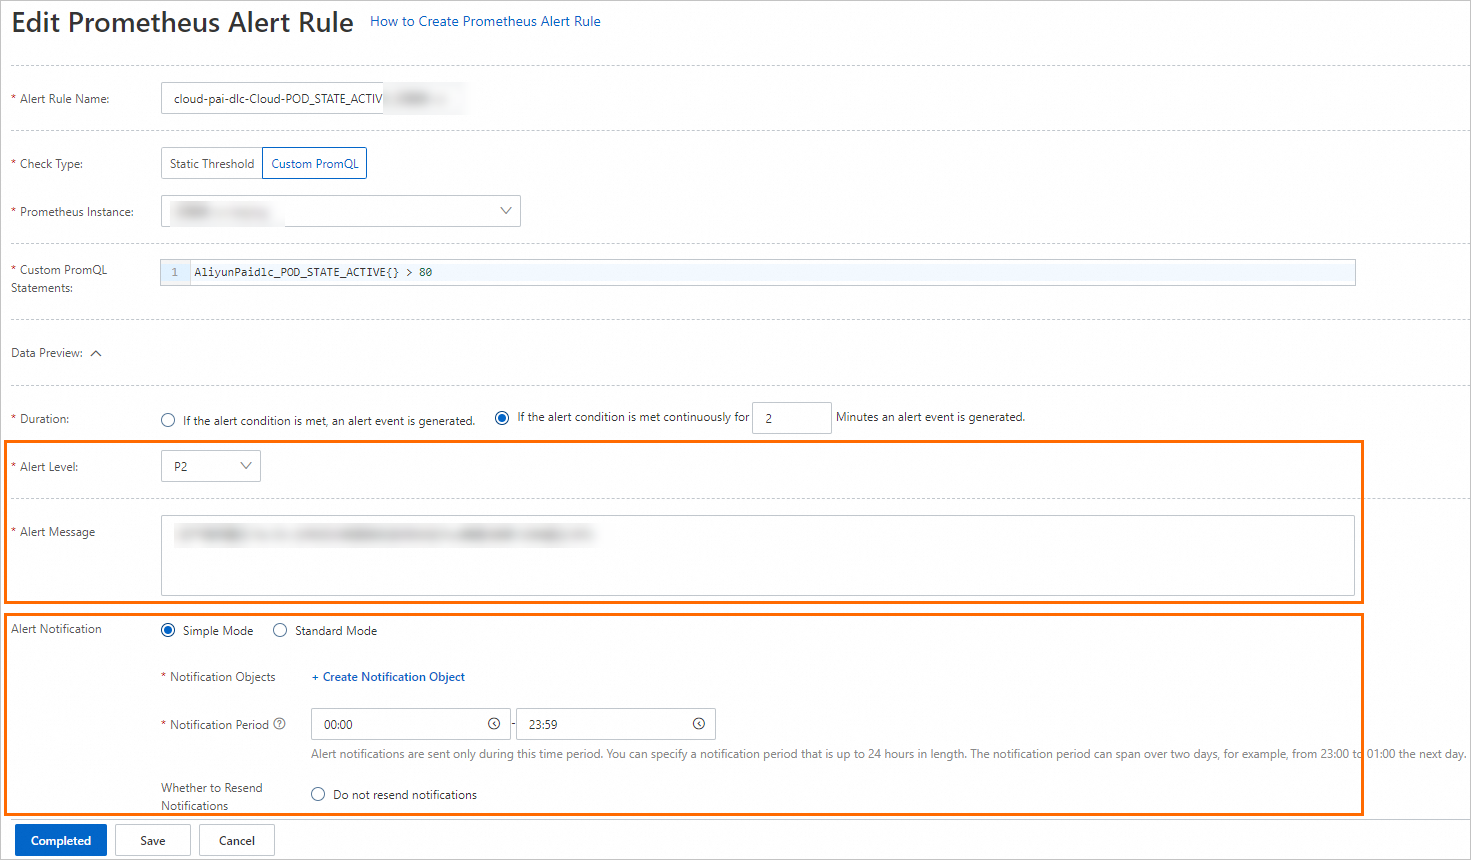
-