Train regression models on datasets with billions of samples and hundreds of thousands of features using the PS-SMART algorithm.
Limitations
Input data requirements:
-
Target column must be numeric. Convert STRING types in MaxCompute tables before training.
-
For key-value format data, feature IDs must be positive integers and feature values must be real numbers. Use a serialization component for STRING feature IDs or perform feature engineering (discretization) for categorical strings.
-
Tasks with hundreds of thousands of features consume large resources and run slowly. Use GBDT algorithms instead, which work directly with continuous features. One-hot encode categorical features to filter low-frequency features, but avoid discretizing continuous features.
-
The algorithm introduces randomness through data sampling (data_sample_ratio), feature sampling (fea_sample_ratio), histogram approximation, and sketch merging. Tree structures may differ across distributed workers, but model performance remains similar. Inconsistent results across runs with identical data and parameters are expected.
-
Increase computing cores to accelerate training. Training starts only after all resources are allocated. Requesting more resources increases waiting time when the cluster is busy.
Configuration
Visual interface
Add the PS-SMART Regression component to the Designer canvas and configure parameters in the right pane.
|
Parameter type |
Parameter |
Description |
|
Fields setting |
Is sparse format |
Separates key-value pairs in sparse format with spaces. Separates keys and values with colons (:). Example: 1:0.3 3:0.9. |
|
Select feature columns |
Feature columns from the input table for training. For dense format, select only BIGINT or DOUBLE columns. For sparse key-value format with numeric keys and values, select only STRING columns. |
|
|
Select label column |
Label column from the input table. Supports STRING and numeric types. Internally converts to numeric types only, such as 0 and 1 for binary classification. |
|
|
Select weight column |
Column for weighting each sample row. Supports numeric types only. |
|
|
Parameters setting |
Objective function type |
Available types:
|
|
Tweedie distribution index |
Available only when Objective function type is Tweedie regression. Specifies the index of the relationship between variance and mean of the Tweedie distribution. |
|
|
Evaluation metric type |
Available types:
|
|
|
Number of trees |
Number of trees. Must be a positive integer. Training time increases proportionally with tree count. |
|
|
Maximum tree depth |
Default: 5 (maximum 32 leaf nodes). |
|
|
Data sampling ratio |
When building each tree, samples a portion of data to build a weak learner, accelerating training. |
|
|
Feature sampling ratio |
When building each tree, samples a portion of features to build a weak learner, accelerating training. |
|
|
L1 penalty coefficient |
Controls leaf node size. Larger values produce more uniform distribution. Increase to reduce overfitting. |
|
|
L2 penalty coefficient |
Controls leaf node size. Larger values produce more uniform distribution. Increase to reduce overfitting. |
|
|
Learning rate |
Range: (0,1). |
|
|
Approximate sketch precision |
Quantile threshold for splitting when constructing a sketch. Smaller values produce more buckets. Use default value 0.03. |
|
|
Minimum split loss change |
Minimum loss change required to split a node. Larger values produce more conservative splits. |
|
|
Number of features |
Number of features or maximum feature ID. If not configured, the system automatically calculates the value by starting an SQL task. |
|
|
Global bias |
Initial prediction value for all samples. |
|
|
Random number generator seed |
Seed for the random number generator. Must be an integer. |
|
|
Feature importance type |
Available types:
|
|
|
Execution tuning |
Number of cores |
System-allocated by default. |
|
Memory per core (MB) |
Memory per core in MB. System-allocated by default. |
PAI commands
Configure parameters for the PS-SMART Regression component by calling PAI commands from the SQL script component. For more information, see SQL Script.
# Train the model.
PAI -name ps_smart
    -project algo_public
    -DinputTableName="smart_regression_input"
    -DmodelName="xlab_m_pai_ps_smart_bi_545859_v0"
    -DoutputTableName="pai_temp_24515_545859_2"
    -DoutputImportanceTableName="pai_temp_24515_545859_3"
    -DlabelColName="label"
    -DfeatureColNames="features"
    -DenableSparse="true"
    -Dobjective="reg:linear"
    -Dmetric="rmse"
    -DfeatureImportanceType="gain"
    -DtreeCount="5"
    -DmaxDepth="5"
    -Dshrinkage="0.3"
    -Dl2="1.0"
    -Dl1="0"
    -Dlifecycle="3"
    -DsketchEps="0.03"
    -DsampleRatio="1.0"
    -DfeatureRatio="1.0"
    -DbaseScore="0.5"
    -DminSplitLoss="0"
# Make predictions.
PAI -name prediction
    -project algo_public
    -DinputTableName="smart_regression_input";
    -DmodelName="xlab_m_pai_ps_smart_bi_545859_v0"
    -DoutputTableName="pai_temp_24515_545860_1"
    -DfeatureColNames="features"
    -DappendColNames="label,features"
    -DenableSparse="true"
-Dlifecycle="28"|
Parameter type |
Parameter |
Required |
Default |
Description |
|
Data parameters |
featureColNames |
Yes |
None |
Feature columns from the input table for training. For dense format, select only BIGINT or DOUBLE columns. For sparse key-value format with numeric keys and values, select only STRING columns. |
|
labelColName |
Yes |
None |
Label column from the input table. Supports STRING and numeric types. Internally converts to numeric types only, such as 0 and 1 for binary classification. |
|
|
weightCol |
No |
None |
Column for weighting each sample row. Supports numeric types only. |
|
|
enableSparse |
No |
false |
Whether data is in sparse format. Valid values: {true,false}. Separates key-value pairs with spaces. Separates keys and values with colons (:). Example: 1:0.3 3:0.9. |
|
|
inputTableName |
Yes |
None |
Name of the input table. |
|
|
modelName |
Yes |
None |
Name of the output model. |
|
|
outputImportanceTableName |
No |
None |
Name of the output table containing feature importance information. |
|
|
inputTablePartitions |
No |
None |
Format: ds=1/pt=1. |
|
|
outputTableName |
No |
None |
Output table in MaxCompute, in binary format. |
|
|
lifecycle |
No |
3 |
Output table lifecycle in days. |
|
|
Algorithm parameters |
objective |
Yes |
reg:linear |
Objective function type. Available types:
|
|
metric |
No |
None |
Evaluation metric type for the training dataset. Output is written to the stdout file in the Logview coordinator area. Available types:
|
|
|
treeCount |
No |
1 |
Number of trees. Training time increases proportionally with this value. |
|
|
maxDepth |
No |
5 |
Maximum depth of a tree. Range: 1 to 20. |
|
|
sampleRatio |
No |
1.0 |
Data sampling ratio. Range: (0,1]. Value of 1.0 indicates no sampling. |
|
|
featureRatio |
No |
1.0 |
Feature sampling ratio. Range: (0,1]. Value of 1.0 indicates no sampling. |
|
|
l1 |
No |
0 |
L1 penalty coefficient. Larger values produce more uniform leaf node distribution. Increase to reduce overfitting. |
|
|
l2 |
No |
1.0 |
L2 penalty coefficient. Larger values produce more uniform leaf node distribution. Increase to reduce overfitting. |
|
|
shrinkage |
No |
0.3 |
Learning rate. Range: (0,1). |
|
|
sketchEps |
No |
0.03 |
Quantile threshold for splitting when constructing a sketch. The number of buckets is O(1.0/sketchEps). Smaller values produce more buckets. Use default value. Range: (0,1). |
|
|
minSplitLoss |
No |
0 |
Minimum loss change required to split a node. Larger values produce more conservative splits. |
|
|
featureNum |
No |
None |
Number of features or maximum feature ID. If this parameter is not configured when estimating resource usage, the system automatically calculates the value by starting an SQL task. |
|
|
baseScore |
No |
0.5 |
Initial prediction value for all samples. |
|
|
randSeed |
No |
None |
Seed for the random number generator. Must be an integer. |
|
|
featureImportanceType |
No |
gain |
Method to calculate feature importance. Available methods:
|
|
|
tweedieVarPower |
No |
1.5 |
Index of the relationship between the variance and mean of the Tweedie distribution. |
|
|
Tuning parameters |
coreNum |
No |
System allocated |
Number of cores. Larger values accelerate the algorithm. |
|
No |
System allocated |
Memory per core in MB. |
Example
-
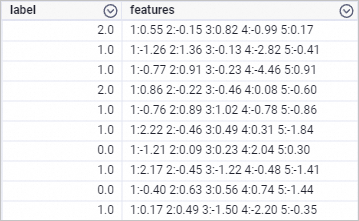
Use the ODPS SQL node to run the SQL statement below and generate input data. This example uses key-value format.
drop table if exists smart_regression_input;
create table smart_regression_input as
select
*
from
(
select 2.0 as label, '1:0.55 2:-0.15 3:0.82 4:-0.99 5:0.17' as features
    union all
select 1.0 as label, '1:-1.26 2:1.36 3:-0.13 4:-2.82 5:-0.41' as features
    union all
select 1.0 as label, '1:-0.77 2:0.91 3:-0.23 4:-4.46 5:0.91' as features
    union all
select 2.0 as label, '1:0.86 2:-0.22 3:-0.46 4:0.08 5:-0.60' as features
    union all
select 1.0 as label, '1:-0.76 2:0.89 3:1.02 4:-0.78 5:-0.86' as features
    union all
select 1.0 as label, '1:2.22 2:-0.46 3:0.49 4:0.31 5:-1.84' as features
    union all
select 0.0 as label, '1:-1.21 2:0.09 3:0.23 4:2.04 5:0.30' as features
    union all
select 1.0 as label, '1:2.17 2:-0.45 3:-1.22 4:-0.48 5:-1.41' as features
    union all
select 0.0 as label, '1:-0.40 2:0.63 3:0.56 4:0.74 5:-1.44' as features
    union all
select 1.0 as label, '1:0.17 2:0.49 3:-1.50 4:-2.20 5:-0.35' as features
) tmp;
Generated data is shown below.
-
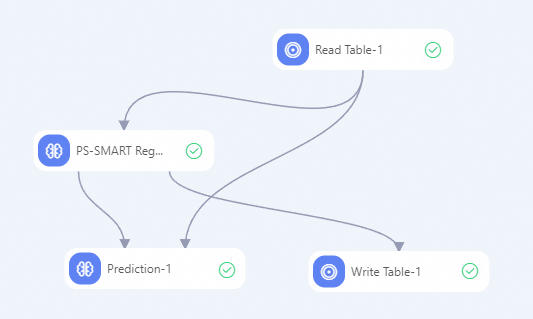
Build the workflow below and run the components. For more information, see Algorithm modeling.
-
In the component list on the left of the Designer canvas, search for Read Table, PS-SMART Regression, Prediction, and Write Table components, then drag them to the canvas.
-
Configure component parameters.
-
Click the Read Table-1 component on the canvas. On the Select Table tab in the right pane, set Table Name to smart_regression_input.
-
Click the PS-SMART Regression-1 component on the canvas. In the right pane, configure parameters as shown in the table below. Use default values for remaining parameters.
Parameter type
Parameter
Description
Fields setting
Is sparse format
Select the Is sparse format check box.
Feature columns
Select the features column.
Label column
Select the label column.
Parameters setting
Objective function type
Set to Linear regression.
Evaluation metric type
Select rooted mean square error.
Number of trees
Set to 5.
-
Click the Prediction-1 component on the canvas. In the right pane, configure parameters as shown in the table below. Use default values for remaining parameters.
Parameter type
Parameter
Description
Fields setting
Feature columns
By default, all columns are selected. Extra columns do not affect prediction results.
Pass-through columns
Select the label column.
Sparse matrix
Select the Sparse matrix check box.
Key-value separator
Set to a colon (:).
Separator between key-value pairs
Set to a space.
-
Click the Write Table-1 component on the canvas. In the right pane, on the Select Table tab, set Table Name for Output to smart_regression_output.
-
-
After configuring parameters, click the run button
 to run the workflow.
-
-
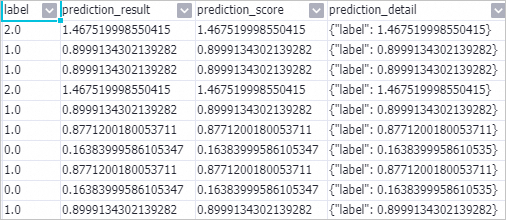
Right-click the Prediction-1 component and choose .
-
To view feature importance, right-click the PS-SMART Regression-1 component and select from the shortcut menu.
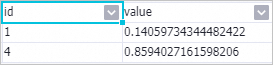
The id column indicates the ordinal number of the input feature. Because the input data in this example is in key-value format, the id column represents the key in the key-value pair. The feature importance table contains only two features, indicating only these two features were used during tree splitting. Other features have importance 0. The value column indicates the feature importance type. Default value is gain, which is the sum of information gain that the feature contributes to the model.
Model deployment
To deploy the model generated by the PS-SMART component as an online service, add the General-purpose Model Export component downstream of the PS-SMART component. Configure component parameters the same way as other PS-series components. For more information, see General-purpose Model Export.
Upon successful execution, deploy the model service on the PAI-EAS Model Online Service page. For more information, see Deploy a service in the console.
References
-
For more information about Designer components, see Designer overview.
-
Designer provides a variety of algorithm components. Select appropriate components to process data for different scenarios. For more information, see Designer component overview.