Train binary classification models using the PS-SMART algorithm for large-scale datasets with billions of samples and features.
Limitations
Supports MaxCompute computing engine only.
Prerequisites
-
Target column must contain numeric values: 0 for negative samples, 1 for positive samples. Convert STRING types before training. Example: convert Good/Bad to 1/0.
-
For key-value (KV) format data, feature IDs must be positive integers and feature values must be real numbers. Use the serialization component to convert STRING feature IDs. Apply feature engineering (such as discretization) for categorical string values.
-
Training with hundreds of thousands of features is resource-intensive and slow. For better performance, use GBDT-like algorithms that train directly on continuous features. Apply One-Hot encoding to categorical features and filter low-frequency features. Avoid discretizing continuous numerical features.
-
The PS-SMART algorithm introduces randomness through data sampling (data_sample_ratio), feature sampling (fea_sample_ratio), histogram approximation, and sketch merging order. Tree structures may differ across distributed workers. Model performance remains similar. Expect inconsistent results across runs with identical data and parameters.
-
Increase number of computing cores to accelerate training. Training starts after all servers obtain required resources. Requesting more resources during high cluster usage may increase wait time.
Configuration
Configure the PS-SMART Binary Classification component using one of these methods.
Configure through UI
Configure component parameters on the Designer workflow page.
|
Tab |
Parameter |
Description |
|
Fields Setting |
Use Sparse Format |
Sparse format uses spaces to separate KV pairs and colons (:) to separate key from value. Example: 1:0.3 3:0.9. |
|
Feature Columns |
Feature columns from the input table for training. For dense format, select numeric columns only (BIGINT or DOUBLE). For sparse KV format with numeric key and value, select STRING columns only. |
|
|
Label Column |
Label column of the input table. Supports STRING and numeric types. Content must be numeric values (0 and 1 for binary classification). |
|
|
Weight Column |
Column used to weight sample rows. Supports numeric types. |
|
|
Parameter Settings |
Evaluation Metric Type |
Evaluation metric types:
|
|
Number of Trees |
Number of trees. Must be a positive integer. Training time increases with more trees. |
|
|
Maximum Tree Depth |
Maximum tree depth. Default: 5 (maximum 16 leaf nodes). Must be a positive integer. |
|
|
Data Sampling Ratio |
Sample portion of data when building each tree. Accelerates training. |
|
|
Feature Sampling Ratio |
Sample portion of features when building each tree. Accelerates training. |
|
|
L1 Penalty Coefficient |
Controls leaf node size. Larger values create more uniform leaf node distribution. Increase to reduce overfitting. |
|
|
L2 Penalty Coefficient |
Controls leaf node size. Larger values create more uniform leaf node distribution. Increase to reduce overfitting. |
|
|
Learning Rate |
Value range: (0,1). |
|
|
Approximate Sketch Precision |
Quantile threshold for splitting when constructing sketch. Smaller values create more buckets. Default: 0.03. Manual configuration not required. |
|
|
Minimum Split Loss Change |
Minimum loss change required to split a node. Larger values result in more conservative splitting. |
|
|
Number of Features |
Number of features or maximum feature ID. If not configured, the system starts an SQL task to calculate automatically when estimating resource usage. |
|
|
Global Bias Term |
Initial prediction value for all samples. |
|
|
Random Number Generator Seed |
Random number seed. Must be an integer. |
|
|
Feature Importance Type |
Feature importance types:
|
|
|
Execution Tuning |
Number of Computing Cores |
System automatically allocates cores. |
|
Memory Size per Core |
Memory per core in MB. Manual configuration usually not required. System allocates memory automatically. |
Configure through PAI commands
Use Platform for AI (PAI) commands to configure component parameters. Use the SQL script component to call PAI commands. For more information, see SQL Script.
# Train.
PAI -name ps_smart
    -project algo_public
    -DinputTableName="smart_binary_input"
    -DmodelName="xlab_m_pai_ps_smart_bi_545859_v0"
    -DoutputTableName="pai_temp_24515_545859_2"
    -DoutputImportanceTableName="pai_temp_24515_545859_3"
    -DlabelColName="label"
    -DfeatureColNames="f0,f1,f2,f3,f4,f5"
    -DenableSparse="false"
    -Dobjective="binary:logistic"
    -Dmetric="error"
    -DfeatureImportanceType="gain"
    -DtreeCount="5"
    -DmaxDepth="5"
    -Dshrinkage="0.3"
    -Dl2="1.0"
    -Dl1="0"
    -Dlifecycle="3"
    -DsketchEps="0.03"
    -DsampleRatio="1.0"
    -DfeatureRatio="1.0"
    -DbaseScore="0.5"
    -DminSplitLoss="0";

# Predict.
PAI -name prediction
    -project algo_public
    -DinputTableName="smart_binary_input"
    -DmodelName="xlab_m_pai_ps_smart_bi_545859_v0"
    -DoutputTableName="pai_temp_24515_545860_1"
    -DfeatureColNames="f0,f1,f2,f3,f4,f5"
    -DappendColNames="label,qid,f0,f1,f2,f3,f4,f5"
    -DenableSparse="false"
-Dlifecycle="28";|
Module |
Parameter |
Required |
Description |
Default value |
|
Data parameters |
featureColNames |
Yes |
Feature columns from the input table for training. For dense format, select numeric columns only (BIGINT or DOUBLE). For sparse KV format with numeric key and value, select STRING columns only. |
None |
|
labelColName |
Yes |
Label column of the input table. Supports STRING and numeric types. For internal storage, numeric types only are supported (example: 0 and 1 for binary classification). |
None |
|
|
weightCol |
No |
Column used to weight each sample row. Supports numeric types. |
None |
|
|
enableSparse |
No |
Specifies whether the format is sparse. Valid values: {true,false}. Sparse format uses spaces to separate KV pairs and colons (:) to separate key from value. Example: 1:0.3 3:0.9. |
false |
|
|
inputTableName |
Yes |
Input table name. |
None |
|
|
modelName |
Yes |
Output model name. |
None |
|
|
outputImportanceTableName |
No |
Output table name for feature importance. |
None |
|
|
inputTablePartitions |
No |
Format is ds=1/pt=1. |
None |
|
|
outputTableName |
No |
Output table in MaxCompute. Table is in binary format and cannot be read. Retrieve through the SMART prediction component only. |
None |
|
|
lifecycle |
No |
Lifecycle of output table in days. |
3 |
|
|
Algorithm parameters |
objective |
Yes |
Objective function type. For binary classification training, select binary:logistic. |
None |
|
metric |
No |
Evaluation metric type for the training dataset. Output is written to stdout file in the Coordinator section of Logview. Supported types:
|
None |
|
|
treeCount |
No |
Number of trees. Training time is proportional to tree count. |
1 |
|
|
maxDepth |
No |
Maximum tree depth. Must be a positive integer from 1 to 20. |
5 |
|
|
sampleRatio |
No |
Data sampling ratio. Value range: (0,1]. Value 1.0 means no sampling. |
1.0 |
|
|
featureRatio |
No |
Feature sampling ratio. Value range: (0,1]. Value 1.0 means no sampling. |
1.0 |
|
|
l1 |
No |
L1 penalty coefficient. Larger values create more uniform leaf node distribution. Increase to reduce overfitting. |
0 |
|
|
l2 |
No |
L2 penalty coefficient. Larger values create more uniform leaf node distribution. Increase to reduce overfitting. |
1.0 |
|
|
shrinkage |
No |
Learning rate. Value range: (0,1). |
0.3 |
|
|
sketchEps |
No |
Quantile threshold for splitting when constructing sketch. Number of buckets: O(1.0/sketchEps). Smaller values create more buckets. Manual configuration usually not required. Value range: (0,1). |
0.03 |
|
|
minSplitLoss |
No |
Minimum loss change required to split a node. Larger values result in more conservative splits. |
0 |
|
|
featureNum |
No |
Number of features or maximum feature ID. If not configured when estimating resource usage, the system starts an SQL task to calculate automatically. |
None |
|
|
baseScore |
No |
Initial prediction value for all samples. |
0.5 |
|
|
randSeed |
No |
Random number seed. Must be an integer. |
None |
|
|
featureImportanceType |
No |
Feature importance type to calculate. Supported types:
|
gain |
|
|
Tuning parameters |
coreNum |
No |
Number of cores. Larger values increase algorithm speed. |
System allocated |
|
memSizePerCore |
No |
Memory per core in MB. |
System allocated |
Example
-
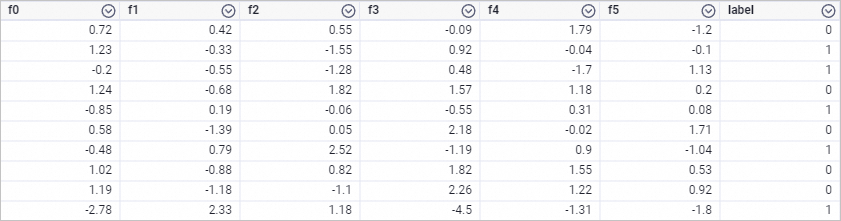
Use the ODPS SQL node to run an SQL statement that generates training data. This example uses dense format data.
drop table if exists smart_binary_input;
create table smart_binary_input lifecycle 3 as
select
*
from
(
select 0.72 as f0, 0.42 as f1, 0.55 as f2, -0.09 as f3, 1.79 as f4, -1.2 as f5, 0 as label
union all
select 1.23 as f0, -0.33 as f1, -1.55 as f2, 0.92 as f3, -0.04 as f4, -0.1 as f5, 1 as label
union all
select -0.2 as f0, -0.55 as f1, -1.28 as f2, 0.48 as f3, -1.7 as f4, 1.13 as f5, 1 as label
union all
select 1.24 as f0, -0.68 as f1, 1.82 as f2, 1.57 as f3, 1.18 as f4, 0.2 as f5, 0 as label
union all
select -0.85 as f0, 0.19 as f1, -0.06 as f2, -0.55 as f3, 0.31 as f4, 0.08 as f5, 1 as label
union all
select 0.58 as f0, -1.39 as f1, 0.05 as f2, 2.18 as f3, -0.02 as f4, 1.71 as f5, 0 as label
union all
select -0.48 as f0, 0.79 as f1, 2.52 as f2, -1.19 as f3, 0.9 as f4, -1.04 as f5, 1 as label
union all
select 1.02 as f0, -0.88 as f1, 0.82 as f2, 1.82 as f3, 1.55 as f4, 0.53 as f5, 0 as label
union all
select 1.19 as f0, -1.18 as f1, -1.1 as f2, 2.26 as f3, 1.22 as f4, 0.92 as f5, 0 as label
union all
select -2.78 as f0, 2.33 as f1, 1.18 as f2, -4.5 as f3, -1.31 as f4, -1.8 as f5, 1 as label
) tmp;
Generated training data:
-
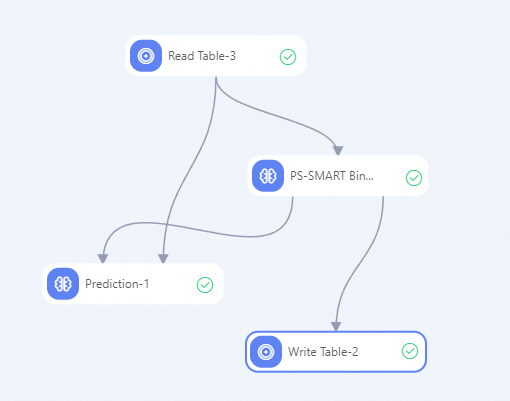
Build the workflow and run components. For more information, see Algorithm modeling.
-
Search for and drag Read Table, PS-SMART Binary Classification Training, Prediction, and Write Table components from the component list on the left side of the Designer canvas to the canvas.
-
Connect the components to build the workflow with upstream and downstream relationships.
-
Configure component parameters.
-
On the canvas, click the Read Table-1 component. On the Select Table tab in the right pane, set Table Name to smart_binary_input.
-
On the canvas, click the PS-SMART Binary Classification Training-1 component. In the right pane, configure parameters as described below. Use default values for other parameters.
Tab
Parameter
Description
Fields Setting
Feature Columns
Select f0, f1, f2, f3, f4, and f5 columns.
Label Column
Select label column.
Parameter Settings
Evaluation Metric Type
Select Area under curve for classification.
Number of Trees
Enter 5.
-
On the canvas, click the Prediction-1 component. On the Fields Setting tab in the right pane, set Reserved Columns to Select All. Use default values for other parameters.
-
On the canvas, click the Write Table-1 component. On the Select Table tab in the right pane, set Output Table Name to smart_binary_output.
-
-
After configuring parameters, click the Run button
 to run the workflow.
-
-
Right-click the Prediction-1 component and choose to view the prediction result.
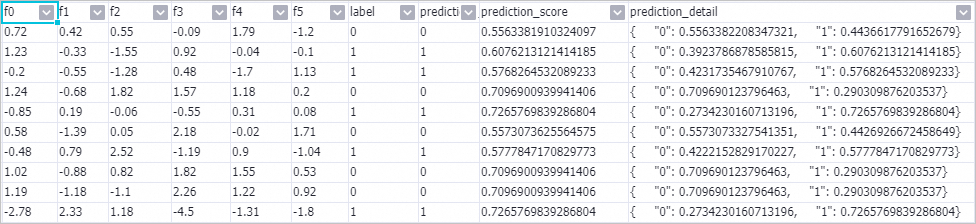
In the prediction_detail column, 1 represents positive samples and 0 represents negative samples.
-
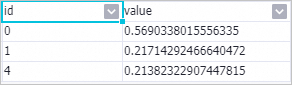
Right-click the PS-SMART Binary Classification Training-1 component and choose to view the feature importance table.
Parameters:
-
id: Ordinal number of the input feature. In this example, input features are f0, f1, f2, f3, f4, and f5. Value 0 in the id column represents the f0 feature column. Value 4 represents the f4 feature column. For key-value (KV) format input data, the id column represents key.
-
value: Feature importance type. Default: gain, which is the sum of information gain the feature brings to the model.
-
The feature importance table contains only three features. Only these three features are used in the tree splitting process. Other features have importance of 0.
-
Model deployment
To deploy the model generated by the PS-SMART component as an online service, add the General-purpose Model Export component downstream of the PS-SMART component. Configure component parameters the same way as other PS-series components. For more information, see General-purpose Model Export.
Upon successful execution, deploy the model service on the PAI-EAS Model Online Service page. For more information, see Deploy a service in the console.
Related information
-
For more information about Designer components, see Designer overview.
-
Designer provides a variety of algorithm components. Select appropriate components for data processing based on your scenario. For more information, see Component reference: All components.