The Multiclass Classification Evaluation component measures how well your model distinguishes between three or more classes. It reports accuracy, recall, F1 score, and a confusion matrix—both per class and as overall averages—so you can identify which classes the model struggles with and guide your next optimization step.
Configure the component
Method 1: Configure on the pipeline page
In Machine Learning Designer in the Platform for AI (PAI) console, add the Multiclass Classification Evaluation component to your pipeline and set the following parameters.
| Tab | Parameter | Description |
|---|---|---|
| Fields Setting | Original Classification Result Column | The label column containing the actual class for each sample. Supports up to 1,000 distinct classes. |
| Predicted Classification Result Column | The column of predicted class labels. Typically set to prediction_result. | |
| Advanced Options | When selected, activates the Predicted Classification Result Column field. | |
| Prediction Result Probability Column | The column used to calculate log loss. Typically set to prediction_detail. Valid only for random forest models—configuring it for other model types may cause an error. | |
| Tuning | Cores | Number of CPU cores to allocate. Determined by the system by default. Must be set together with Memory Size per Core. |
| Memory Size per Core | Memory allocated per core, in MB. Determined by the system by default. |
Method 2: Use PAI commands
Run PAI commands through the SQL Script component. For details on calling PAI commands from a SQL Script component, see Scenario 4: Execute PAI commands within the SQL script component.
PAI -name MultiClassEvaluation -project algo_public
    -DinputTableName="test_input"
    -DoutputTableName="test_output"
    -DlabelColName="label"
    -DpredictionColName="prediction_result"
    -Dlifecycle=30;
The following table describes all available parameters.
| Parameter | Required | Default | Description |
|---|---|---|---|
inputTableName | Yes | — | Name of the input table. |
inputTablePartitions | No | Full table | Partitions to read from the input table. |
outputTableName | Yes | — | Name of the output table. |
labelColName | Yes | — | Column name for the actual class labels in the input table. |
predictionColName | Yes | — | Column name for the predicted class labels. |
predictionDetailColName | No | — | Column name for the predicted class probabilities. Example value: {"A":0.2,"B":0.3,"C":0.5}. |
lifecycle | No | — | Retention period of the output table, in days. |
coreNum | No | System-determined | Number of CPU cores to allocate. |
memSizePerCore | No | System-determined | Memory per core, in MB. |
Example
This example creates a small dataset with two classes (A and B), runs the evaluation, and examines the output.
Step 1: Create sample data
Add a SQL Script component to the canvas and run the following SQL to generate a test table with 10 rows.
drop table if exists multi_esti_test;
create table multi_esti_test as
select * from
(
  select '0' as id, 'A' as label, 'A' as prediction, '{"A": 0.6, "B": 0.4}' as detail
  union all
  select '1' as id, 'A' as label, 'B' as prediction, '{"A": 0.45, "B": 0.55}' as detail
  union all
  select '2' as id, 'A' as label, 'A' as prediction, '{"A": 0.7, "B": 0.3}' as detail
  union all
  select '3' as id, 'A' as label, 'A' as prediction, '{"A": 0.9, "B": 0.1}' as detail
  union all
  select '4' as id, 'B' as label, 'B' as prediction, '{"A": 0.2, "B": 0.8}' as detail
  union all
  select '5' as id, 'B' as label, 'B' as prediction, '{"A": 0.1, "B": 0.9}' as detail
  union all
  select '6' as id, 'B' as label, 'A' as prediction, '{"A": 0.52, "B": 0.48}' as detail
  union all
  select '7' as id, 'B' as label, 'B' as prediction, '{"A": 0.4, "B": 0.6}' as detail
  union all
  select '8' as id, 'B' as label, 'A' as prediction, '{"A": 0.6, "B": 0.4}' as detail
  union all
  select '9' as id, 'A' as label, 'A' as prediction, '{"A": 0.75, "B": 0.25}' as detail
)tmp;
Step 2: Run the evaluation
Add another SQL Script component and run the following PAI command.
drop table if exists ${o1};
PAI -name MultiClassEvaluation -project algo_public
    -DinputTableName="multi_esti_test"
    -DoutputTableName=${o1}
    -DlabelColName="label"
    -DpredictionColName="prediction"
    -Dlifecycle=30;
Step 3: View the results
Right-click the SQL Script component and choose View Data > SQL Script Output.
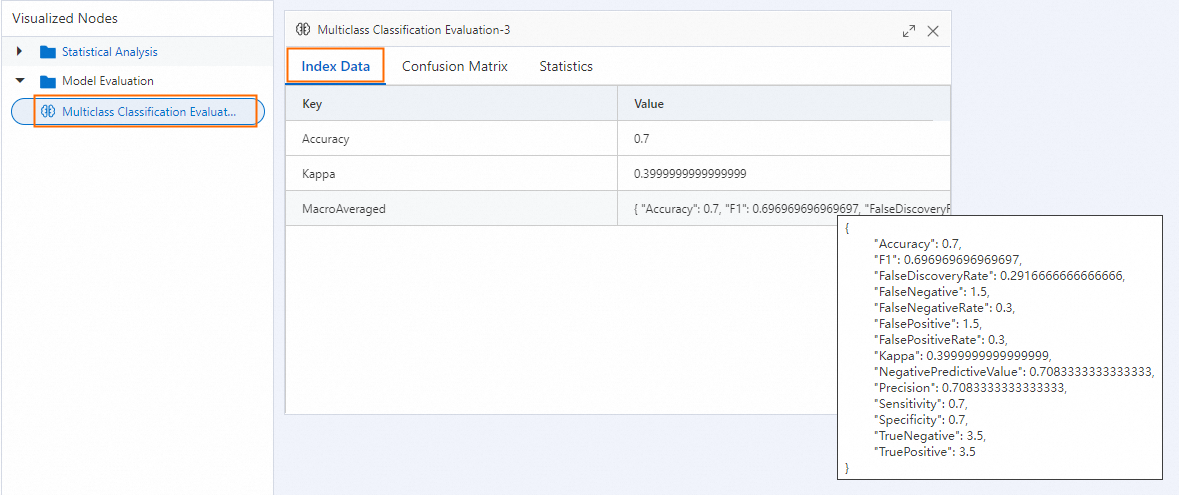
The output is a JSON object. The key sections are described in Interpret the output below.
Interpret the output
The output JSON contains three logical groups: per-class metrics, overall averages, and distribution statistics.
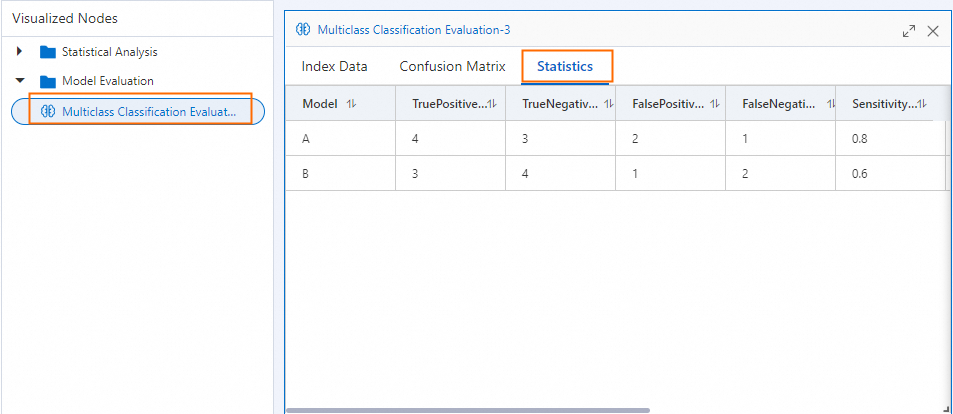
Per-class metrics
LabelMeasureList reports one set of metrics for each class in LabelList. The table below shows values from the example above.
| Metric | Class A | Class B | Range | Direction | What it means |
|---|---|---|---|---|---|
| Accuracy | 0.70 | 0.70 | [0, 1] | Higher is better | Proportion of all samples correctly classified for this class |
| Precision | 0.67 | 0.75 | [0, 1] | Higher is better | Of all samples predicted as this class, how many actually belong to it |
| Sensitivity (recall) | 0.80 | 0.60 | [0, 1] | Higher is better | Of all samples that actually belong to this class, how many were correctly identified |
| F1 score | 0.73 | 0.67 | [0, 1] | Higher is better | Harmonic mean of precision and recall; useful when both matter equally |
| Specificity | 0.60 | 0.80 | [0, 1] | Higher is better | Proportion of negative samples correctly rejected for this class |
| False positive rate | 0.40 | 0.20 | [0, 1] | Lower is better | Proportion of actual negatives incorrectly predicted as this class |
| False negative rate | 0.20 | 0.40 | [0, 1] | Lower is better | Proportion of actual positives missed for this class |
| False discovery rate | 0.33 | 0.25 | [0, 1] | Lower is better | Proportion of positive predictions that are incorrect |
| Negative predictive value | 0.75 | 0.67 | [0, 1] | Higher is better | Of all samples predicted as negative for this class, how many truly are |
| Kappa | 0.40 | 0.40 | [-1, 1] | Higher is better | Agreement between predictions and actual labels, adjusted for chance (> 0.6 is generally considered good) |
Overall averages
OverallMeasures reports three averaging strategies across all classes. Use the one that fits your class distribution:
| Strategy | Key in output | When to use |
|---|---|---|
| Macro-averaged | MacroAveraged | Classes are roughly balanced, or you want minority classes to have equal weight. When classes are imbalanced, use this to avoid majority classes dominating the score. |
| Micro-averaged | MicroAveraged | You have many more samples in some classes and want larger classes to contribute more to the overall score. |
| Label frequency-based micro | LabelFrequencyBasedMicro | Weighted by label frequency; in a balanced dataset this equals micro-averaged. |
For this example, all three strategies produce an overall accuracy of 0.70 and a kappa of 0.40, because the two classes have equal sample counts (5 each).
When your classes are imbalanced, macro-averaged and micro-averaged results will differ. Focus on macro-averaged metrics to give equal weight to underrepresented classes.
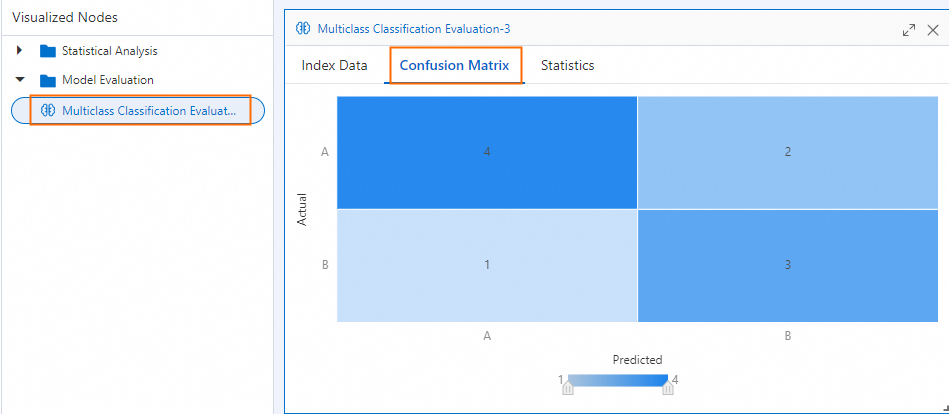
Confusion matrix
ConfusionMatrix is a 2D array where ConfusionMatrix[i][j] is the number of samples from actual class i predicted as class j. For this example:
| Predicted A | Predicted B | |
|---|---|---|
| Actual A | 4 (TP) | 1 (FN) |
| Actual B | 2 (FP) | 3 (TN) |
ProportionMatrix shows the same data as row-normalized proportions (each row sums to 1.0).
Distribution statistics
| Field | Description |
|---|---|
ActualLabelFrequencyList | Sample count per class in the input data: [5, 5] |
ActualLabelProportionList | Proportion per class in the input data: [0.5, 0.5] |
PredictedLabelFrequencyList | Sample count per class in the predictions: [6, 4] |
PredictedLabelProportionList | Proportion per class in the predictions: [0.6, 0.4] |
A significant difference between actual and predicted distributions indicates systematic bias toward certain classes.
Appendix
If you run the component on the pipeline page, right-click the Multiclass Classification Evaluation component and select Visual Analysis to view the results in chart form.