Triangle counting identifies all triangles in a graph, where a triangle is a set of three mutually connected vertices. Use this algorithm to measure graph cohesiveness, compute clustering coefficients, and detect communities in social networks.
Configure the component
Method 1: Configure the component on the pipeline page
On the pipeline details page in Machine Learning Designer, add the Counting Triangle component to the pipeline and configure the parameters in the following table.
| Tab | Parameter | Description |
|---|---|---|
| Fields setting | Start Vertex | The start vertex column in the edge table. |
| End Vertex | The end vertex column in the edge table. | |
| Parameters setting | Largest Vertex Degree | The vertex degree threshold above which sampling is applied. Default value: 500. |
| Tuning | Workers | The number of vertices for parallel job execution. Higher values increase both the degree of parallelism and framework communication overhead. |
| Memory Size per Worker (MB) | The maximum memory available to a single job. Unit: MB. Default value: 4096. If memory usage exceeds this value, an OutOfMemory error is reported. | |
| Data Split Size (MB) | The data split size. Unit: MB. Default value: 64. |
Method 2: Configure the component using PAI commands
Use the SQL Script component to call PAI commands. For more information, see Scenario 4: Execute PAI commands within the SQL script component.
PAI -name TriangleCount
    -project algo_public
    -DinputEdgeTableName=TriangleCount_func_test_edge
    -DfromVertexCol=flow_out_id
    -DtoVertexCol=flow_in_id
-DoutputTableName=TriangleCount_func_test_result;| Parameter | Required | Default | Description |
|---|---|---|---|
inputEdgeTableName | Yes | — | The name of the input edge table. |
inputEdgeTablePartitions | No | Full table | The partitions to read from the input edge table. |
fromVertexCol | Yes | — | The start vertex column in the input edge table. |
toVertexCol | Yes | — | The end vertex column in the input edge table. |
outputTableName | Yes | — | The name of the output table. |
outputTablePartitions | No | — | The partitions in the output table. |
lifecycle | No | — | The lifecycle of the output table. |
maxEdgeCnt | No | 500 | The vertex degree threshold above which sampling is applied. |
workerNum | No | — | The number of vertices for parallel job execution. Higher values increase both the degree of parallelism and framework communication overhead. |
workerMem | No | 4096 | The maximum memory available to a single job. Unit: MB. If memory usage exceeds this value, an OutOfMemory error is reported. |
splitSize | No | 64 | The data split size. Unit: MB. |
Example
This example creates a graph with 7 vertices and runs triangle counting to find all triangles in the graph.
Add a SQL Script component to the pipeline and click the component. On the Parameters Setting tab, clear Use Script Mode and Whether the system adds a create table statement, then enter the following SQL statements in the SQL Script editor.
drop table if exists TriangleCount_func_test_edge;
create table TriangleCount_func_test_edge as
select * from
(
  select '1' as flow_out_id,'2' as flow_in_id
  union all
  select '1' as flow_out_id,'3' as flow_in_id
  union all
  select '1' as flow_out_id,'4' as flow_in_id
  union all
  select '1' as flow_out_id,'5' as flow_in_id
  union all
  select '1' as flow_out_id,'6' as flow_in_id
  union all
  select '2' as flow_out_id,'3' as flow_in_id
  union all
  select '3' as flow_out_id,'4' as flow_in_id
  union all
  select '4' as flow_out_id,'5' as flow_in_id
  union all
  select '5' as flow_out_id,'6' as flow_in_id
  union all
  select '5' as flow_out_id,'7' as flow_in_id
  union all
  select '6' as flow_out_id,'7' as flow_in_id
)tmp;
drop table if exists TriangleCount_func_test_result;
create table TriangleCount_func_test_result
(
  node1 string,
  node2 string,
  node3 string
);
Data structure 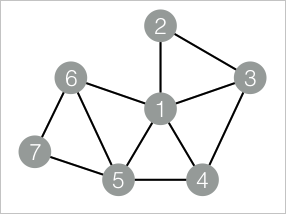
Add another SQL Script component to the pipeline and connect it to the component added in step 1. On the Parameters Setting tab, clear Use Script Mode and Whether the system adds a create table statement, then enter the following SQL statements in the SQL Script editor.
drop table if exists ${o1};
PAI -name TriangleCount
    -project algo_public
    -DinputEdgeTableName=TriangleCount_func_test_edge
    -DfromVertexCol=flow_out_id
    -DtoVertexCol=flow_in_id
    -DoutputTableName=${o1};
Click
 in the upper-left corner of the canvas to run the pipeline.
After the pipeline run completes, right-click the component added in step 2, click View data, and select SQL Script Output.
The output lists all detected triangles. Each row represents one triangle, with
node1,node2, andnode3being the three vertices that form it.node1 node2 node3 1 2 3 1 3 4 1 4 5 1 5 6 5 6 7 The algorithm finds 5 triangles in the graph. Vertex 1 participates in four of them due to its high connectivity, while vertices 5, 6, and 7 form one triangle at the periphery of the graph.