Fraudsters rarely act alone. They operate in networks—sharing accounts, addresses, devices, and contacts. Traditional rule-based systems evaluate each person independently and miss these hidden connections. Graph algorithms detect fraud by analyzing the relationships between people, not just individual attributes.
This tutorial shows how to use the Financial Risk Management pipeline template in PAI Designer to calculate a fraud probability score for each person in a relationship network.
How the pipeline detects fraud
The pipeline represents people as vertices and their relationships as edges. Each edge has a count value that measures closeness—a higher value means a stronger relationship.
Three graph algorithm components run in sequence:
Maximum Connected Subgraph — classifies the people in the relationship graph into two groups and assigns an ID to each group. Then, together with the SQL Script and JOIN components, it removes unrelated people by finding the set that contains the largest number of interlinked people.
Single-Source Shortest Path — measures how many people Enoch must contact to reach the desired people. The output
distancefield records this hop count.Label Propagation Classification — propagates fraud labels from known cases (Evan, a fraudster) through the network. Labels spread from labeled vertices to their adjacent vertices. The output
weightfield records the probability that each person is a fraudster.
Dataset
The pipeline uses a relationship dataset with the following fields.
| Field | Type | Description |
|---|---|---|
start_point | STRING | Start vertex of an edge. The name of a person. |
end_point | STRING | End vertex of an edge. The name of a person. |
count | DOUBLE | Closeness between two people. A higher value indicates a closer relationship. |
The following figure shows the sample data used in the pipeline. 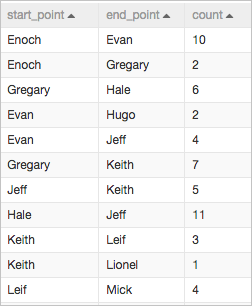
Prerequisites
Before you begin, ensure that you have:
A PAI workspace. For setup instructions, see the PAI documentation.
Access to the PAI console with permissions to use Designer.
Build and run the pipeline
Step 1: Open Designer
Log on to the PAI console.
In the left-side navigation pane, click Workspaces. On the Workspaces page, click the name of your workspace.
In the left-side navigation pane, choose Model Training > Visualized Modeling (Designer).
Step 2: Create the pipeline from a template
On the Visualized Modeling (Designer) page, click the Preset Templates tab.
Find the Financial Risk Management template and click Create.
In the Create Pipeline dialog box, review the parameters. The Data Storage parameter sets the Object Storage Service (OSS) bucket path where the pipeline stores temporary data and models during runtime. The default values work for this tutorial.
Click OK. The pipeline takes about 10 seconds to create.
On the Pipelines tab, double-click the Financial Risk Management pipeline to open it on the canvas.
The canvas shows the pipeline with three sections. ![]()
| Section | Components | Purpose |
|---|---|---|
| ① | Maximum Connected Subgraph → SQL Script → JOIN | Classifies people into two groups and assigns an ID to each group. Then removes unrelated people by finding the set with the largest number of interlinked people. |
| ② | Single-Source Shortest Path | Calculates the number of people Enoch must contact to reach the desired people. The distance field in the output records this value. |
| ③ | Data Source → Label Propagation Classification → SQL Script | Imports labeled data (where weight = fraud probability), propagates fraud labels from known fraudsters through the network to adjacent vertices, and filters the results to show each person's fraud probability. |
Step 3: Run the pipeline and view results
In the upper-left corner of the canvas, click
 to run the pipeline.
After the run completes, right-click SQL on the canvas and select View Data.
The output table shows the probability of each person being a fraudster.
Why graph algorithms detect fraud that rule-based systems miss
The following figure shows an example relationship graph. Arrows represent relationships such as colleagues or relatives. In this graph, Enoch is a trusted customer and Evan is a fraudster. 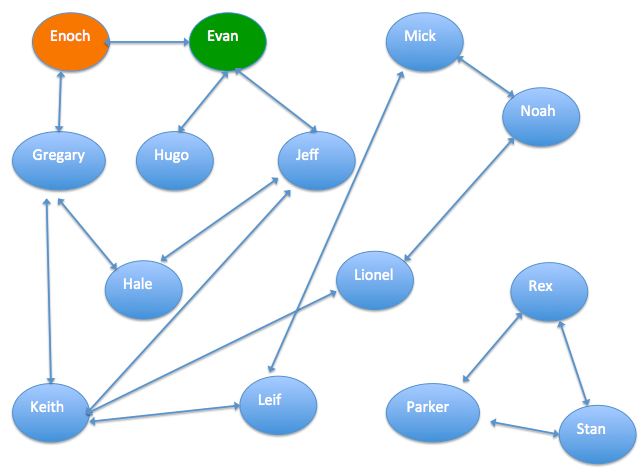
Machine Learning Platform for AI (PAI) provides several graph algorithm components for relationship analysis, including K-Core, Maximum Connected Subgraph, and Label Propagation Classification. These components analyze relationship structures to surface risk signals that individual-level models miss.
How label propagation works: Label Propagation Classification is a semi-supervised classification algorithm. It uses a relationship graph and labeled data as its input, and predicts the labels of unlabeled vertices based on the labels of labeled ones. Label propagation propagates the label of each vertex to the vertices adjacent to it.