This topic describes how to use collaborative filtering to recommend products.
Background information
The correlation between diapers and beer is a typical example of data mining. On the surface, diapers and beer seem to have no remarkable relations. However, when they are placed next to each other on shelves in supermarkets, the sales of both products significantly increase. You can use collaborative filtering, a commonly used data mining algorithm, to explore the hidden correlations between different types of products. This can provide insights on how product sales can be boosted.
Collaborative filtering is based on association rules. For example, if both User 1 and User 2 purchased Products A and B, you can assume that User 1 and User 2 have similar interests in shopping. If User 1 purchases Product C but User 2 does not, you can recommend Product C to User 2. This is a typical example of user-based collaborative filtering, in which users are correlated based on their characteristics.
In the pipeline that is described in this topic, the system obtains the correlations between products based on the shopping behavior of users before July. Then, the system recommends products to users based on the correlations and evaluates recommendation results. For example, if User 1 purchased Product A before July and Product A is strongly correlated with Product B, the system recommends Product B to User 1 in July or later, and verifies whether the recommendation is effective.
The dataset used in this topic is for reference only.
Take note of the following items about the pipeline:
The pipeline only shows how to use collaborative filtering in an e-commerce scenario. Many key factors such as the time series are not considered.
The pipeline considers only the correlations between products, but not the properties of the products, for example, whether a product is frequently purchased by the same user. For example, mobile phones are not items frequently purchased by the same user. If a user buys a mobile phone in June, the user is unlikely to buy another mobile phone in July. The pipeline does not take this factor into consideration.
We recommend that you use product recommendation based on collaborative filtering as an add-on to your service. To increase the accuracy of the prediction, we recommend that you use a model that is trained by using a machine learning algorithm.
Datasets
The pipeline described in this topic is based on a dataset provided by the Tianchi Big Data Competition. The dataset includes the shopping behavior before July and the shopping behavior in July and later. The following table describes the fields in the dataset.
Field | Meaning | Data type | Description |
user_id | User ID | STRING | The ID of the user. |
item_id | Item ID | STRING | The ID of the item. |
active_type | Shopping behavior | STRING |
|
active_date | Purchase date | STRING | The date on which the user purchased the item. |
The following figure shows the sample raw data that is used in the pipeline. 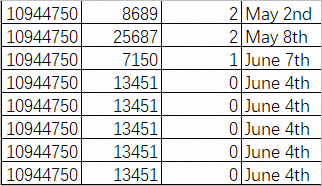
Procedure for using collaborative filtering to recommend products
Go to the Machine Learning Designer page.
Log on to the PAI console.
In the left-side navigation pane, click Workspaces. On the Workspaces page, click the name of the workspace that you want to manage.
In the left-side navigation pane, choose .
Create a pipeline.
On the Visualized Modeling (Designer) page, click the Preset Templates tab.
In the Recommended Algorithms - Product Recommendation section of the Preset Templates tab, click Create.
In the Create Pipeline dialog box, configure the parameters. You can use their default values.
The value specified for the Pipeline Data Path parameter is the Object Storage Service (OSS) bucket path of the temporary data and models generated during the runtime of the pipeline.
Click OK.
It requires about 10 seconds to create the pipeline.
On the Pipelines tab, select the Recommended Algorithms - Product Recommendation pipeline and click Open.
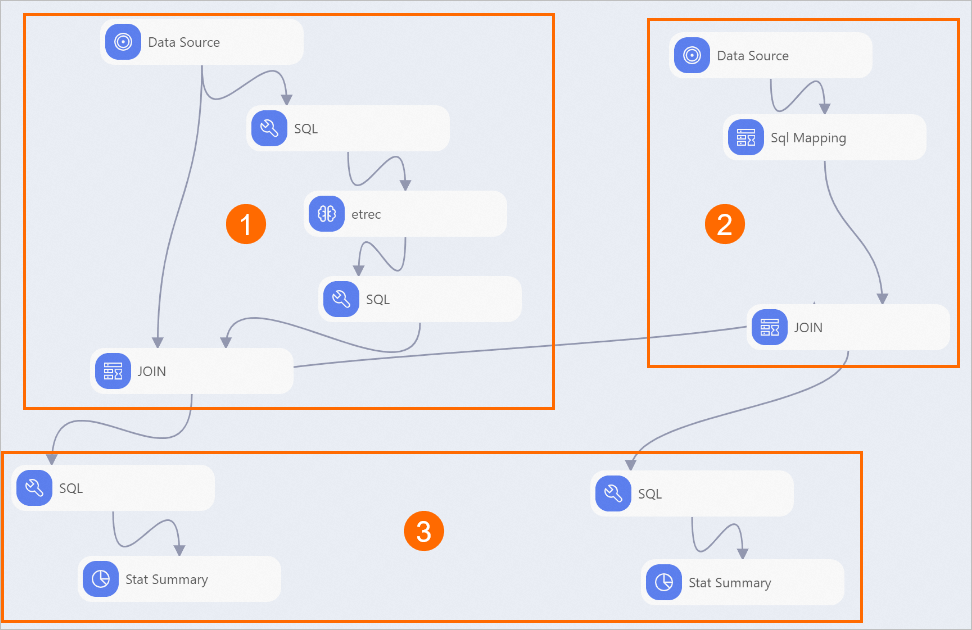
View the components of the pipeline on the canvas as shown in the following figure. The system automatically creates the pipeline based on the preset template.
Area
Description
①
The components in this area generate a recommendation list based on association rules. The SQL component executes SQL statements to obtain the shopping behavior of users before July. Then, the etrec component identifies the item that is most similar to each item. This provides insights into products that users may also be interested in and may purchase in the same transaction.
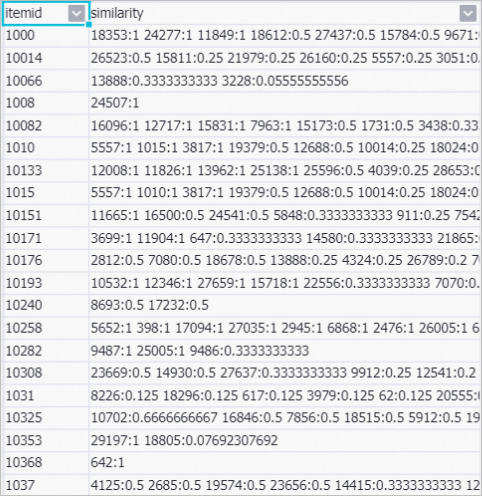
After the pipeline is run, right-click etrec and select . In the dialog box that appears, you can view the correlations between products, as shown in the following figure.
 Parameters:
itemid: the ID of the product on which a shopping behavior is performed.
similarity: the similarity between the product on which a shopping behavior is performed and the product that is most similar to this product. In each value, the number on the left of the colon (:) is the ID of the product that is most similar to the product on which a shopping behavior is performed. The number on the right of the colon (:) is the correlation probability between the two products.
②
The components in this area process the shopping behavior data of July and later. In this pipeline, simple recommendation rules are used. For example, if a user purchased Product A before July and Product A is strongly correlated with Product B, the system recommends Product B to the user in July or later.
③
The components in this area calculate the total number of recommendations and the number of effective recommendations. The Stat Summary component on the left provides the information about the recommendation list that is generated based on the shopping behavior before July. The Stat Summary component on the right provides the information about effective recommendations.
Run the pipeline and view the results.
In the upper-left corner of the canvas, click the
 icon.
icon. After you run the pipeline, right-click Stat Summary on the lower-left part of the canvas and choose to view the generated recommend list.
Right-click Stat Summary on the lower-right part of the canvas and choose View Data>Whole Table Statistics Output Port. Information about effective recommendations is displayed in the dialog box that appears.
For more information about the fields in the table, see the "Output format" section in the Whole Table Statistics topic.