Responsible AI is crucial for AI model developers and business leaders. It is a key practice throughout the AI model lifecycle, including development, training, fine-tuning, evaluation, and deployment. It helps ensure AI models are safe, stable, fair, and aligned with ethical standards. Platform for AI (PAI) supports integrating Responsible AI tools in Data Science Workshop (DSW), enabling fairness analysis, error analysis, and interpretability analysis on your AI models.
How it works
Error analysis, as part of the Responsible AI practice, is a key step in understanding and improving model performance. The core principle is to systematically identify, analyze, and resolve errors in an AI model's predictions to enhance its accuracy and fairness. The core principles of error analysis include:
-
Identify errors: Pinpoint the model's prediction errors. This typically involves comparing the model's predictions with the true values to find discrepancies. Errors can be classified into different types, such as false positives and false negatives.
-
Categorize errors: Classify these errors based on their characteristics. This helps you better understand the root causes, such as data imbalance, insufficient features, or model bias. This process may require domain expertise and human judgment.
-
Analyze the root causes of errors: Analyze the reasons behind each error category. This step is critical because it directly informs model optimization. This may involve analyzing data quality, model design, feature engineering, or data representation.
-
Take corrective actions: Based on the results of the error analysis, the development team can take specific measures to address the model's issues. These measures might include data cleaning, rebalancing the dataset, modifying the model architecture, introducing new features, or using different algorithms.
-
Iterate and evaluate: Error analysis is not a one-time task but a continuous, iterative process. After each modification to the model, you must perform another error analysis to assess if the changes were effective, improved performance, or introduced new issues.
-
Document and report: To ensure transparency and interpretability, thoroughly document the error analysis process, the findings, and the corrective actions taken. This also helps team members understand the model's limitations and provides valuable feedback for other project phases.
This topic uses an example task—predicting whether an individual's annual income is greater than 50K based on a census dataset—to demonstrate using the responsible-ai-toolbox in PAI's DSW to perform error analysis on a model.
Prerequisites
-
A DSW instance. If you do not have one, see Create a DSW instance. The recommended configurations are as follows:
-
Recommended instance type: ecs.gn6v-c8g1.2xlarge
-
Image: Python 3.9 or later. In this topic, the official image used is tensorflow-pytorch-develop:2.14-pytorch2.1-gpu-py311-cu118-ubuntu22.04.
-
Model: responsible-ai-toolbox supports regression and binary classification models based on Sklearn, PyTorch, and TensorFlow frameworks.
-
-
A training dataset: We recommend using your own dataset. To use the example dataset, follow the instructions in Step 3. Prepare the datasets.
-
A model: We recommend using your own model. To use the example model, follow the instructions in Step 5: Train the model.
Step 1: Go to the DSW Gallery
-
Log on to the PAI console.
-
In the top navigation bar, select a region based on your needs.
-
In the navigation pane on the left, choose QuickStart > Notebook Gallery, search for "Responsible AI-Error Analysis", and click Open in DSW on the corresponding card.
-
Select a DSW instance and click Open Notebook. The system opens the "Responsible AI-Error Analysis" Notebook.
Step 2: Import dependencies
Install the dependency package for the responsible-ai-toolbox (raiwidgets) for the subsequent evaluation.
!pip install raiwidgets==0.34.1Import the dependency packages of Responsible AI and Sklearn for subsequent training.
# Import dependencies for Responsible AI

import zipfile
from sklearn.pipeline import Pipeline
from sklearn.impute import SimpleImputer
from sklearn.preprocessing import StandardScaler, OneHotEncoder
from sklearn.compose import ColumnTransformer

import pandas as pd
from lightgbm import LGBMClassifier
from raiutils.dataset import fetch_dataset
import sklearn
from packaging import version
from sklearn.pipeline import Pipeline
from sklearn.impute import SimpleImputer
from sklearn.preprocessing import StandardScaler, OneHotEncoder
from sklearn.compose import ColumnTransformer
Step 3: Prepare the dataset
Download and unzip the required datasets. After unzipping, the files include the training data adult-train.csv and the test data adult-test.csv.
# Specify the name of the dataset file.
outdirname = 'responsibleai.12.28.21'
zipfilename = outdirname + '.zip'

# Download and unzip the dataset
fetch_dataset('https://publictestdatasets.blob.core.windows.net/data/' + zipfilename, zipfilename)
with zipfile.ZipFile(zipfilename, 'r') as unzip:
    unzip.extractall('.')
Step 4: Preprocess the data
-
Load the training data
adult-train.csvand the test dataadult-test.csv. -
Split the training and test data into features and a target variable. The target variable is the true value the model predicts. Features are all other variables in each data instance. In this example, the target variable is
income, and the features includeworkclass,education,marital-status, and others. -
Convert the training data into a NumPy array format for training.
# Load training data and test data.
train_data = pd.read_csv('adult-train.csv', skipinitialspace=True)
test_data = pd.read_csv('adult-test.csv', skipinitialspace=True)


# Define the columns for features and the target variable
target_feature = 'income'
categorical_features = ['workclass', 'education', 'marital-status',
                        'occupation', 'relationship', 'race', 'gender', 'native-country']

# Define a function to split the features and the target variable
def split_label(dataset, target_feature):
    X = dataset.drop([target_feature], axis=1)
    y = dataset[[target_feature]]
    return X, y


# Split the features and the target variable
X_train_original, y_train = split_label(train_data, target_feature)
X_test_original, y_test = split_label(test_data, target_feature)


# Convert to a NumPy array
y_train = y_train[target_feature].to_numpy()
y_test = y_test[target_feature].to_numpy()

# Define a test sample
test_data_sample = test_data.sample(n=500, random_state=5)
You can also load your own dataset. The command for a dataset in CSV format is as follows:
import pandas as pd

# Load your own dataset in CSV format
# Use pandas to read CSV files.
try:
    data = pd.read_csv(filename)
except:
    pass
Step 5: Train the model
In this example, we define a data training pipeline based on Scikit-learn and train a binary classification model.
# Define the ohe_params parameter based on the scikit-learn version
if version.parse(sklearn.__version__) < version.parse('1.2'):
    ohe_params = {"sparse": False}
else:
    ohe_params = {"sparse_output": False}

# Define the classification pipeline for feature transformation. The input parameter X represents the training data.
def create_classification_pipeline(X):
    pipe_cfg = {
        'num_cols': X.dtypes[X.dtypes == 'int64'].index.values.tolist(),
        'cat_cols': X.dtypes[X.dtypes == 'object'].index.values.tolist(),
    }
    num_pipe = Pipeline([
        ('num_imputer', SimpleImputer(strategy='median')),
        ('num_scaler', StandardScaler())
    ])
    cat_pipe = Pipeline([
        ('cat_imputer', SimpleImputer(strategy='constant', fill_value='?')),
        ('cat_encoder', OneHotEncoder(handle_unknown='ignore', **ohe_params))
    ])
    feat_pipe = ColumnTransformer([
        ('num_pipe', num_pipe, pipe_cfg['num_cols']),
        ('cat_pipe', cat_pipe, pipe_cfg['cat_cols'])
    ])

    pipeline = Pipeline(steps=[('preprocessor', feat_pipe),
                               ('model', LGBMClassifier(random_state=0))])

    return pipeline

# Create the classification model training pipeline
pipeline = create_classification_pipeline(X_train_original)

# Train the model
model = pipeline.fit(X_train_original, y_train)
Step 6: Add the Responsible AI component
Run the following script to add the error analysis component to Responsible AI and compute insights with rai_insights.
# Import RAI dashboard components
from raiwidgets import ResponsibleAIDashboard
from responsibleai import RAIInsights

# Define the RAIInsights object
from responsibleai.feature_metadata import FeatureMetadata
feature_metadata = FeatureMetadata(categorical_features=categorical_features, dropped_features=[])
rai_insights = RAIInsights(model, train_data, test_data_sample, target_feature, 'classification',
                           feature_metadata=feature_metadata)

# Add an error analysis component
rai_insights.error_analysis.add()

# Perform RAI computation
rai_insights.compute()
Step 7: Create a Responsible AI dashboard
-
Create different cohorts by applying various filters. You can perform error analysis on these filtered cohorts. For example:
-
Age is less than 65 and hours-per-week is greater than 40 hours.
-
marital-statusis "Never-married" or "Divorced". -
Data group index is less than 20.
-
Predicted Y is
>50K. -
True Y is
>50K.
-
Import the
ResponsibleAIDashboardand use the responsible-ai-toolbox to analyze the model.
from raiutils.cohort import Cohort, CohortFilter, CohortFilterMethods
import os
from urllib.parse import urlparse

# Age is less than 65 and hours-per-week is greater than 40
cohort_filter_age = CohortFilter(
    method=CohortFilterMethods.METHOD_LESS,
    arg=[65],
    column='age')
cohort_filter_hours_per_week = CohortFilter(
    method=CohortFilterMethods.METHOD_GREATER,
    arg=[40],
    column='hours-per-week')

user_cohort_age_and_hours_per_week = Cohort(name='Cohort Age and Hours-Per-Week')
user_cohort_age_and_hours_per_week.add_cohort_filter(cohort_filter_age)
user_cohort_age_and_hours_per_week.add_cohort_filter(cohort_filter_hours_per_week)

# marital-status is "Never-married" or "Divorced"
cohort_filter_marital_status = CohortFilter(
    method=CohortFilterMethods.METHOD_INCLUDES,
    arg=["Never-married", "Divorced"],
    column='marital-status')

user_cohort_marital_status = Cohort(name='Cohort Marital-Status')
user_cohort_marital_status.add_cohort_filter(cohort_filter_marital_status)

# Data group index is less than 20.
cohort_filter_index = CohortFilter(
    method=CohortFilterMethods.METHOD_LESS,
    arg=[20],
    column='Index')

user_cohort_index = Cohort(name='Cohort Index')
user_cohort_index.add_cohort_filter(cohort_filter_index)

# Predicted Y is '>50K'
cohort_filter_predicted_y = CohortFilter(
    method=CohortFilterMethods.METHOD_INCLUDES,
    arg=['>50K'],
    column='Predicted Y')

user_cohort_predicted_y = Cohort(name='Cohort Predicted Y')
user_cohort_predicted_y.add_cohort_filter(cohort_filter_predicted_y)

# True Y is '>50K'
cohort_filter_true_y = CohortFilter(
    method=CohortFilterMethods.METHOD_INCLUDES,
    arg=['>50K'],
    column='True Y')

user_cohort_true_y = Cohort(name='Cohort True Y')
user_cohort_true_y.add_cohort_filter(cohort_filter_true_y)

cohort_list = [user_cohort_age_and_hours_per_week,
               user_cohort_marital_status,
               user_cohort_index,
               user_cohort_predicted_y,
               user_cohort_true_y]

# Create the Responsible AI dashboard
metric_frame_tf = ResponsibleAIDashboard(rai_insights, cohort_list=cohort_list, feature_flights="dataBalanceExperience")

# Set the URL for redirection
metric_frame_tf.config['baseUrl'] =  'https://{}-proxy-{}.dsw-gateway-{}.data.aliyun.com'.format(
    os.environ.get('JUPYTER_NAME').replace("dsw-",""),
    urlparse(metric_frame_tf.config['baseUrl']).port,
    os.environ.get('dsw_region') )
Step 8: Analyze errors on the Responsible AI dashboard
Click the URL to access the Responsible AI dashboard.

View the error analysis:
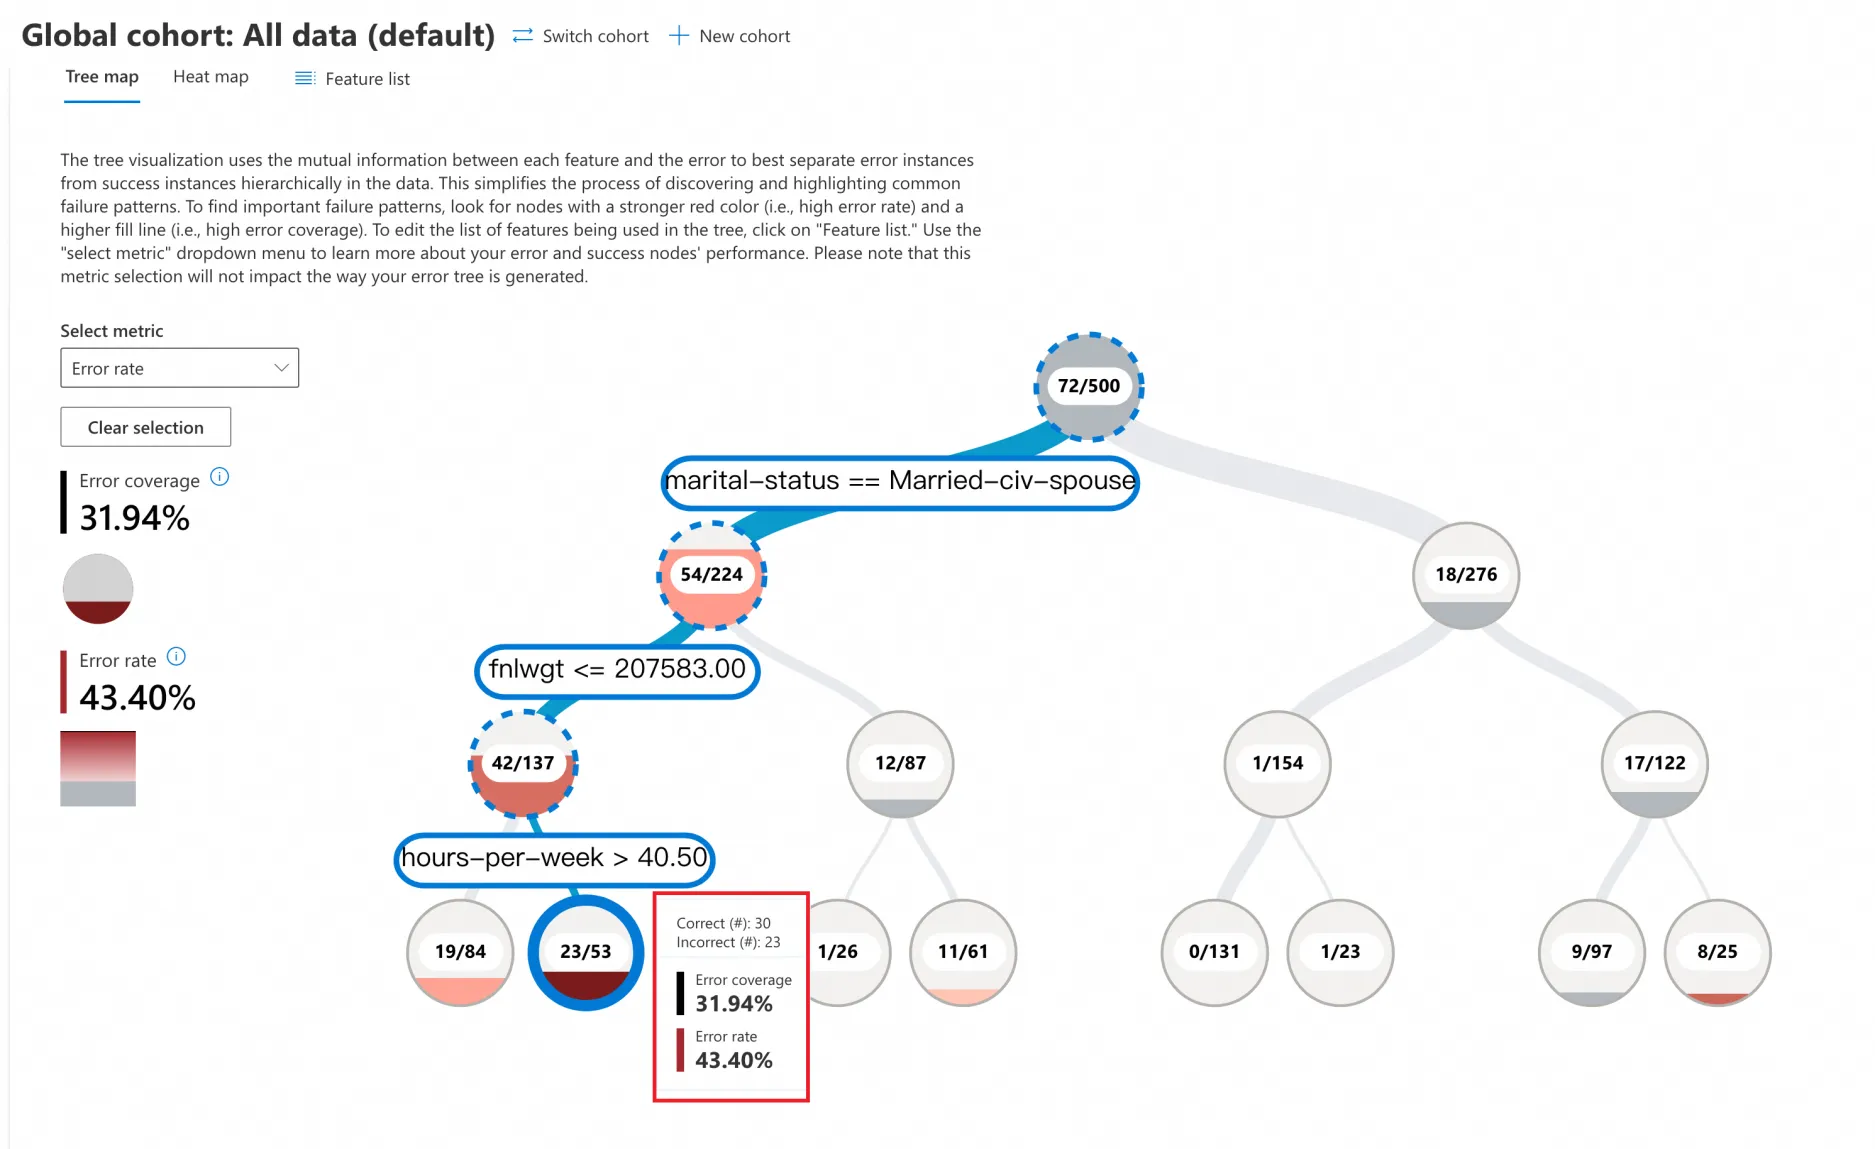
Tree Map
-
Click Tree map, and in the Select metric dropdown, choose Error rate. The error analysis tree view splits the data into a binary tree based on the different values of the model's features. For example, the two branches under the root node of the tree represent:
-
marital-status == Married-civ-spouse(54/224)
-
marital-status != Married-civ-spouse(18/276)
-
-
This example contains 500 samples with 72 prediction errors, resulting in an error rate of 72/500 = 14.4%. Each node in the binary tree shows the total number of data points that meet the branch's condition, along with the number of prediction errors and the error rate.
-
Focus on the red nodes. A deeper shade of red indicates a higher error rate.
-
In this example, click the darkest red leaf node to see that the model's prediction error rate is as high as 43.40% for data meeting these conditions:
-
marital-status == Married-civ-spouse
-
fnlwgt <= 207583
-
hours-per-week > 40.5
-
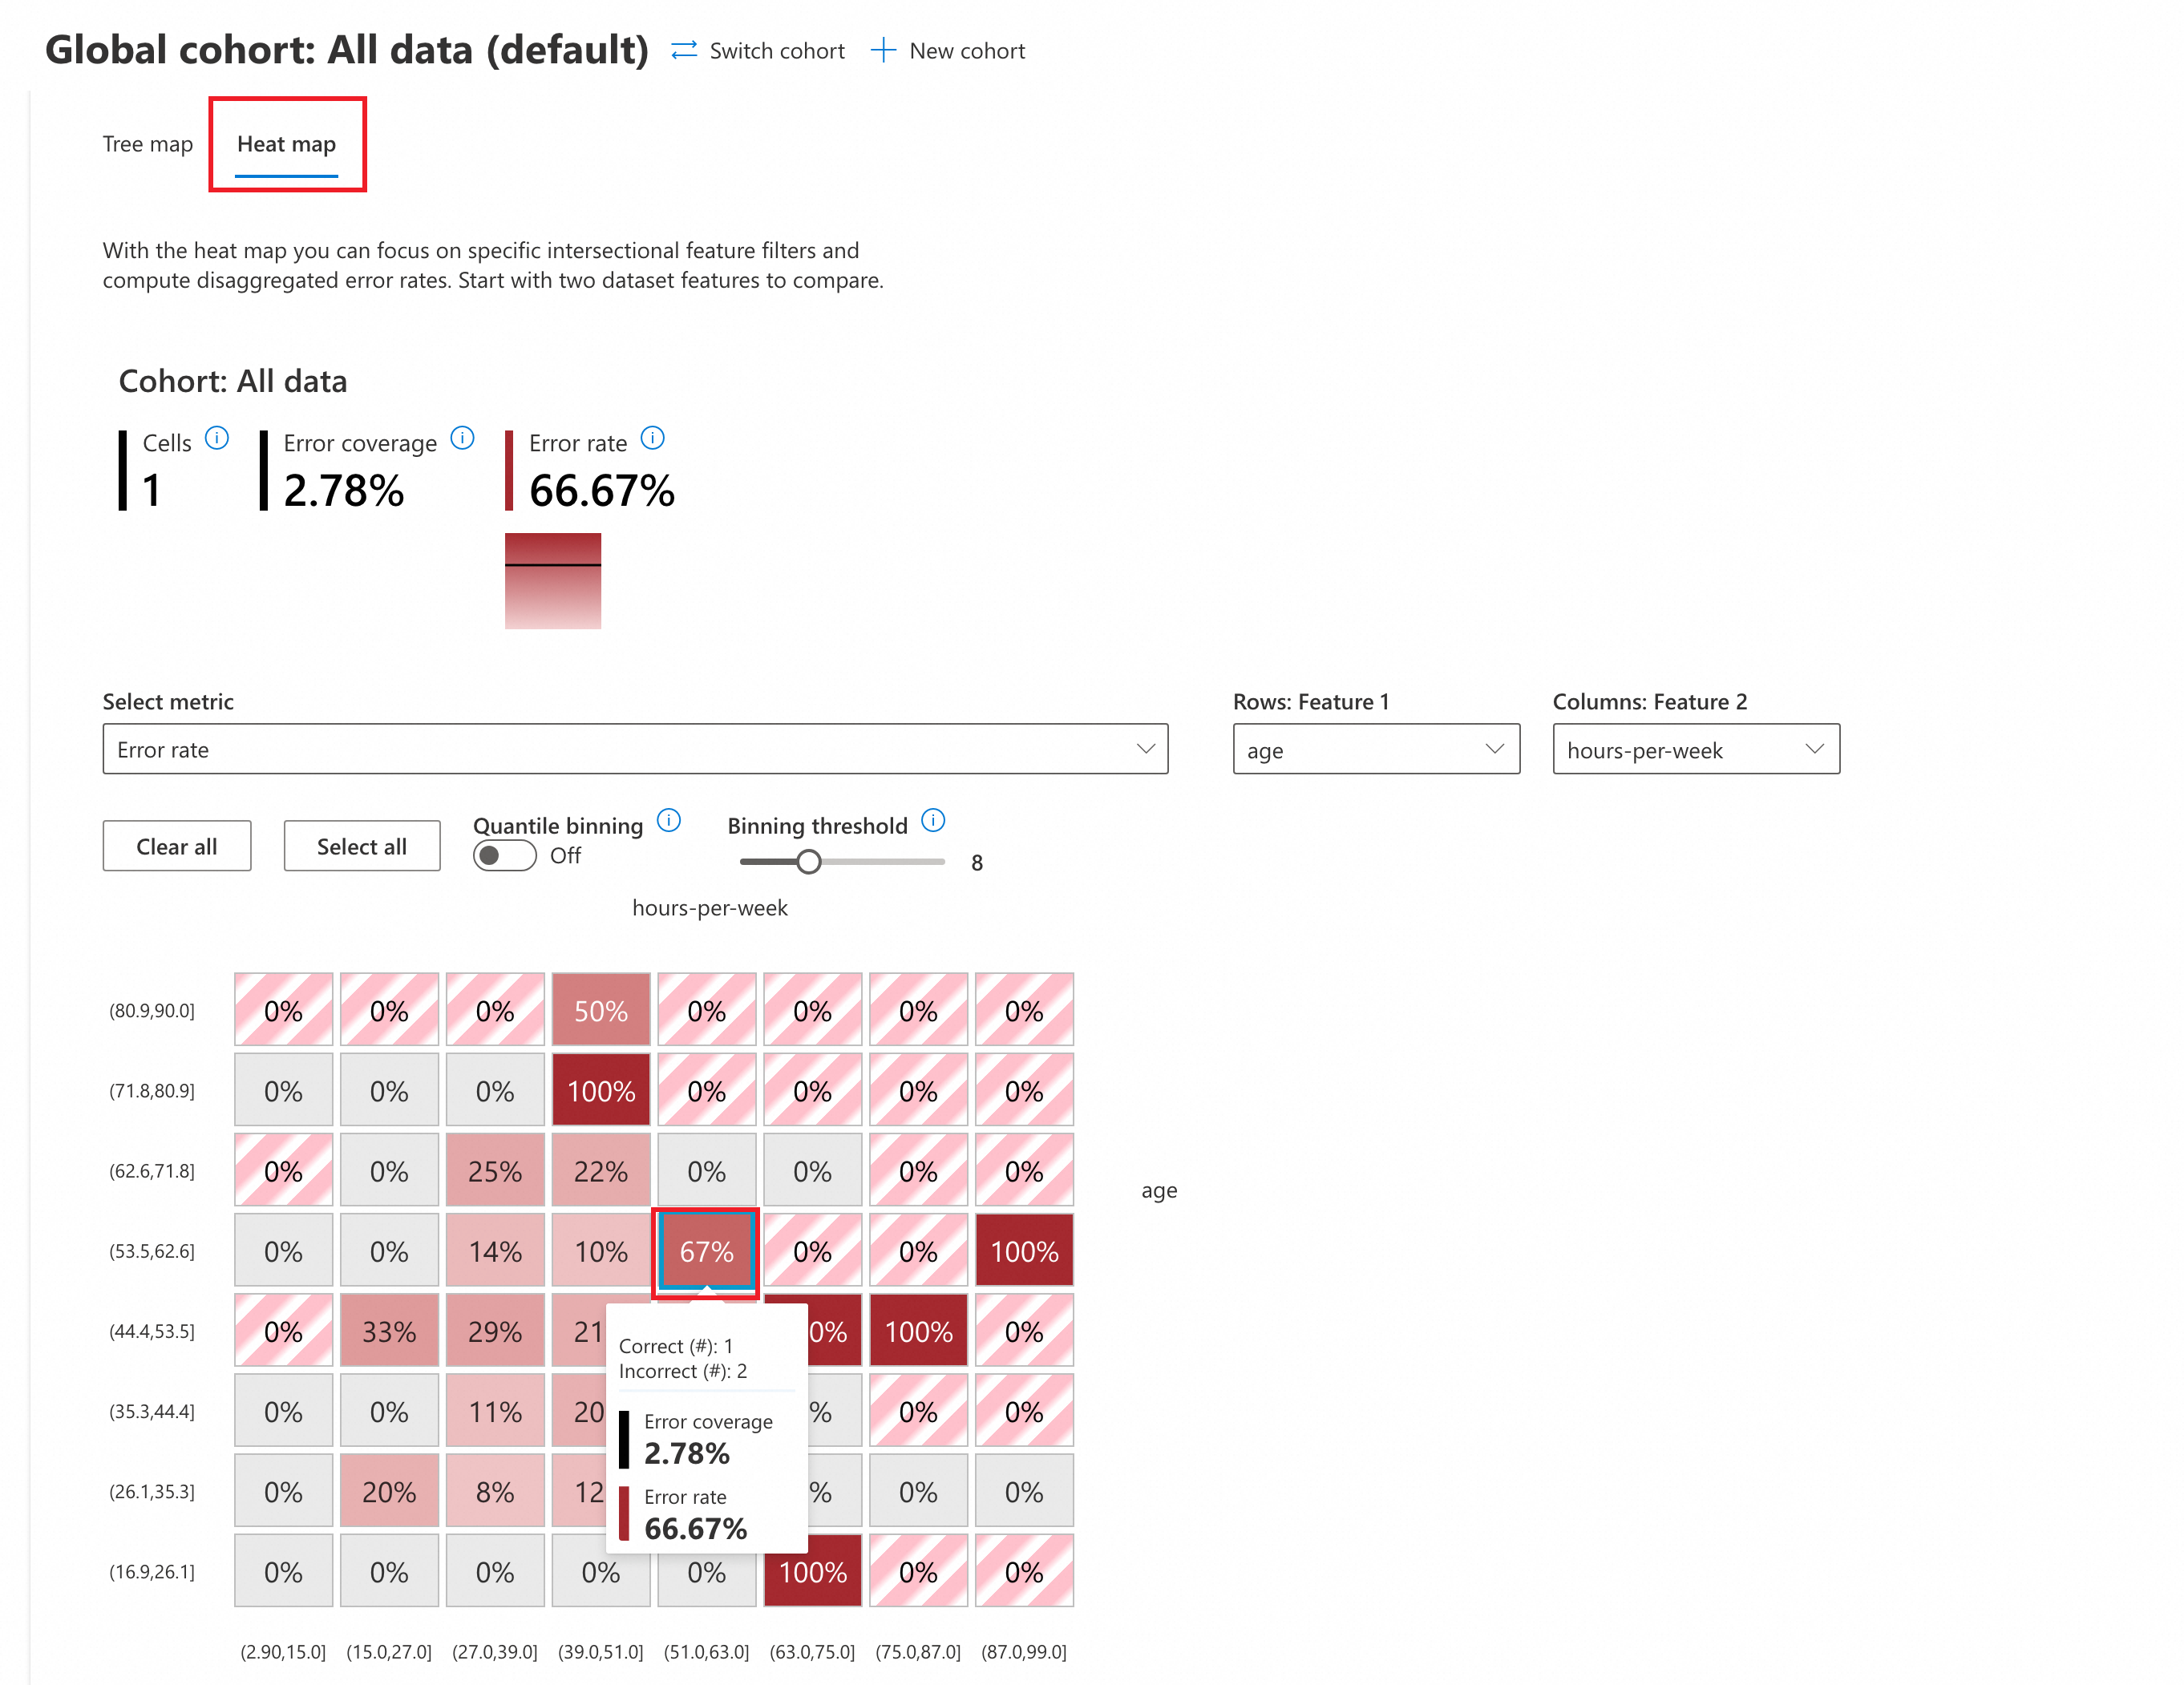
Heat map
-
Click Heat map to switch to the heat map view. In the Select metric dropdown, choose Error rate to perform an error analysis.
-
(Optional) Configure the parameters:
-
Quantile binning: This method divides a continuous variable into several intervals, each containing the same number of data points.
-
OFF: Uses the default uniform binning strategy, where each interval has the same length.
-
ON: Enables quantile binning. Each interval will contain the same number of data points, ensuring an even distribution of data across intervals.
-
-
Binning threshold: Sets the number of data intervals. Adjusting the threshold changes the number of intervals (in this example, the default is 8, which splits
ageandhours-per-weekinto 8 equal intervals).
-
-
In the heat map, you can select two input features for cross-analysis. This example uses
ageandhours-per-weekfor the heat map analysis. -
Focus on the red cells. A deeper shade of red indicates a higher error rate.
-
The analysis shows that the error rate is highest (up to 100%) where the two features fall into these ranges:
-
age [71.8,80.9], hours-per-week[39.0,51.0]
-
age [44.4,53.5], hours-per-week[75.0,87.0]
-
age [16.9,26.1], hours-per-week[63.0,75.0]
-
...
-