Use PAI to quickly build a user churn prediction model.
Background
Building a user churn prediction model allows you to identify customers who are likely to churn and take proactive measures to retain them.
Traditional churn monitoring solutions are often rule-based. These methods lack intelligent prediction capabilities and may fail to accurately identify at-risk users.
Solution
PAI provides a complete solution for feature encoding, classification model training, and model evaluation based on labeled data. The requirements are as follows:
-
Expertise: Basic knowledge of machine learning modeling.
-
Development cycle: 1 to 2 days.
-
Data: A labeled dataset with thousands of records describing the characteristics of customers who have churned.
Prerequisites
-
You have activated PAI and created a workspace. For more information, see Activate PAI and create a default workspace.
-
The workspace is associated with MaxCompute resources. For more information, see Quick start - Preparations.
Dataset
This pipeline uses an anonymized dataset of real customer behavior from the telecommunications sector. It contains 7,043 samples, which include basic user information and churn attributes. The feature data includes the following fields.
|
Parameter |
Description |
|
customerid |
The customer ID. |
|
gender |
The customer's gender. |
|
SeniorCitizen |
Indicates whether the customer is a senior citizen. Valid values:
|
|
Partner |
Indicates whether the customer has a partner. |
|
Dependents |
Indicates whether the customer has dependents. |
|
tenure |
The number of months the customer has been with the company. |
|
PhoneService |
Indicates whether the customer subscribes to a phone service. |
|
MultipleLines |
Indicates whether the customer has multiple lines. |
|
InternetService |
The customer's internet service provider. For example, DSL or Fiber optic. |
|
OnlineSecurity |
Indicates whether the customer subscribes to the online security service. |
|
OnlineBackup |
Indicates whether the customer uses the online backup service. |
|
DeviceProtection |
Indicates whether the customer has the device protection service. |
|
TechSupport |
Indicates whether the customer has requested technical support. |
|
StreamingTV |
Indicates whether the customer subscribes to the streaming TV service. |
|
StreamingMovies |
Indicates whether the customer subscribes to the streaming movies service. |
|
Contract |
The contract term. For example, Month-to-month or Two-year. |
|
PaperlessBilling |
Indicates whether the customer uses paperless billing. |
|
PaymentMethod |
The payment method. |
|
MonthlyCharges |
The monthly charge. |
|
TotalCharges |
The total charges. |
The target data includes the following field.
|
Parameter |
Description |
|
churn |
Indicates whether the customer has churned. |
Procedure
Go to the Machine Learning Designer page.
Log on to the PAI console.
In the left-side navigation pane, click Workspaces. On the Workspaces page, click the name of the workspace that you want to manage.
In the left-side navigation pane, choose .
-
Build the pipeline.
-
On the Designer page, click the Preset Templates tab.
-
Navigate to the Risk Control category under the Business Area, locate the Churn User Monitoring section, and click Create.
-
In the Create Pipeline dialog box, configure the parameters. You can use the default settings for all parameters.
The Data Storage parameter specifies an OSS Bucket path to store temporary data and models generated during the pipeline run.
-
Click Confirm.
It takes about 10 seconds to create the pipeline.
-
In the pipeline list, double-click the Churn User Monitoring pipeline to open it on the canvas.
-
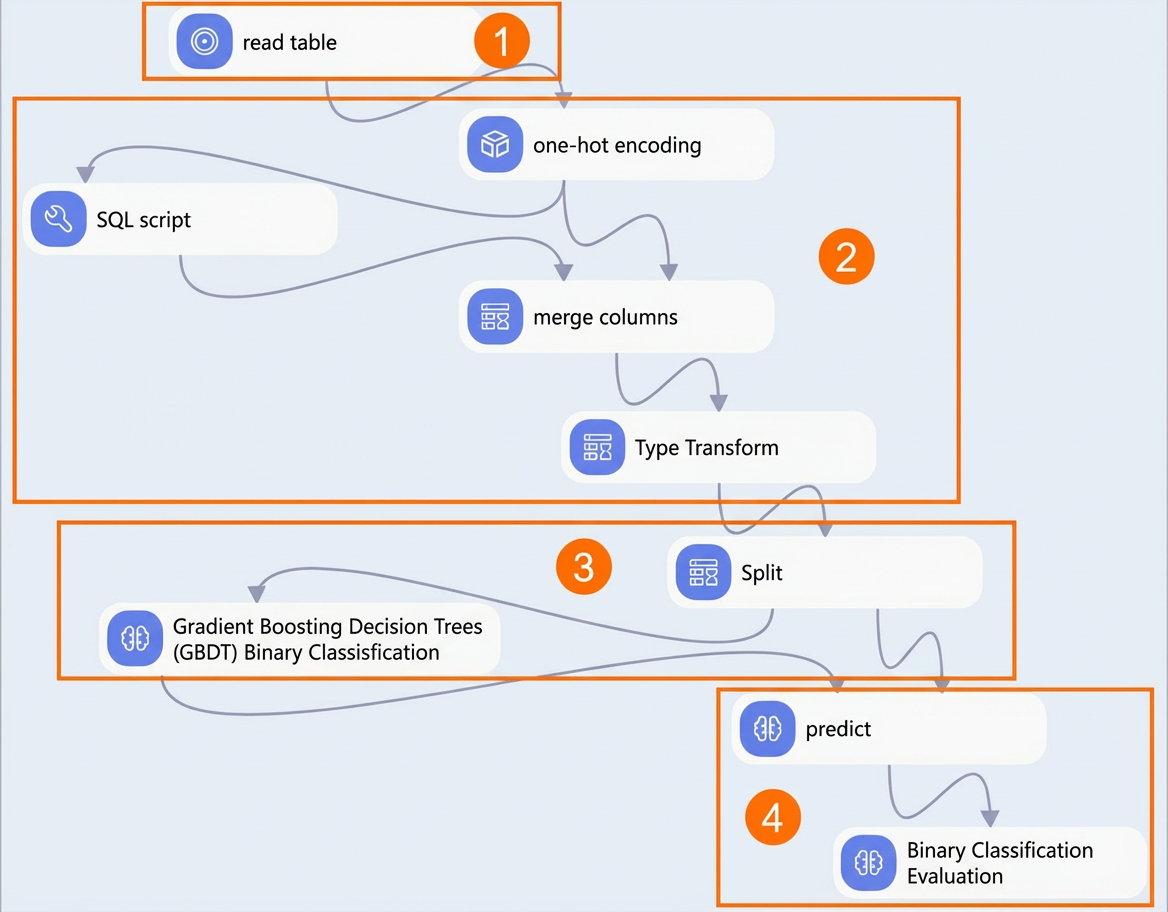
The system automatically builds the pipeline based on the preset template, as shown in the following figure.
Section
Description
①
The dataset for the pipeline.
②
You can use the One Hot Encoding and SQL Script components to perform feature engineering and convert original string-type features into numerical features. For example, for the target field churn, which has the original values Yes or No, you can use an SQL statement to convert Yes to 1 and No to 0, as shown in the following example.
select (case churn when 'Yes' then 1 else 0 end) as churn from ${t1};③
The data is split into a training dataset and a prediction dataset. Because a customer can either churn or not churn, user churn prediction is a binary classification problem that can be solved with binary classification algorithms.
④
The Binary Classification Evaluation component validates the model. You can evaluate its performance using metrics such as AUC, KS value, and F1 score.
-
-
Run the pipeline and view the model results.
-
At the top of the canvas, click Run.
-
When the pipeline run is complete, right-click the Binary Classification Evaluation component on the canvas and select Visual Analysis from the shortcut menu.
-
In the Binary Classification Evaluation dialog box, click the Indicator Data tab to view the model evaluation metrics.
The metrics include KS value, AUC, F1 score, Negative Samples, Positive Samples, and Total Samples. An AUC value closer to 1 indicates higher prediction accuracy. In this example, the AUC value is greater than 0.8, indicating high model prediction accuracy.
-