This topic explains how to manage public opinion risks by analyzing takeaway reviews.
Background
Many businesses use online platforms to collect feedback from customers. This feedback can be positive (praise) or negative (criticism). Businesses must understand public opinion to ensure their product quality meets customer expectations. Analyzing review content also helps businesses identify trends and guide product development.
Online feedback platforms generate a large volume of reviews daily. Manually analyzing large volumes of review data is inefficient and often inaccurate. Automating this process is essential for collecting and assessing public opinion. The PAI platform provides a set of algorithms based on text vectorization and classification. These algorithms use labeled historical reviews to build a classification model to automatically predict the sentiment of new reviews. The complete framework is available as a preset template in Designer. Based on a real-world dataset of 11,987 labeled takeaway reviews, this solution automates public opinion risk management for both positive and negative sentiment, achieving an accuracy of about 75%.
You can use the preset pipeline template in Designer to quickly set up a public opinion risk management solution in one to two days, enabling intelligent, large-scale analysis of reviews. The accuracy of the model improves as more review data is collected. This solution is applicable to various text analysis scenarios, such as spam filtering and sentiment classification for news articles.
Dataset
The dataset for this pipeline contains anonymized, labeled data from a real-world takeaway platform. The following table describes the fields.
|
Field |
Type |
Description |
|
label |
DOUBLE |
Sentiment label. Valid values:
|
|
review |
STRING |
The review content. |
The following are examples from the dataset. Positive reviews (label: 1) include "The food was so delicious and amazing, I feel great, and the delivery was fast" and "Fast delivery, food is still delicious, thumbs up." Negative reviews (label: 0) include "This tastes terrible" and "The food was clearly leftovers, completely different from what I bought before."
Build the risk control pipeline
Go to the Machine Learning Designer page.
Log on to the PAI console.
In the left-side navigation pane, click Workspaces. On the Workspaces page, click the name of the workspace that you want to manage.
In the left-side navigation pane, choose .
-
Build the pipeline.
-
On the Designer page, click the Preset Templates tab.
-
In the template list, select the Public Opinion Risk Control Based on Takeaway Reviews template and click Create.
-
In the Create Pipeline dialog box, configure the parameters. You can use the default settings for all parameters.
The Data Storage parameter specifies an OSS Bucket path to store temporary data and models generated during the pipeline run.
-
Click Confirm.
It takes about 10 seconds to create the pipeline.
-
In the pipeline list, double-click the Public Opinion Risk Control Based on Takeaway Reviews pipeline.
-
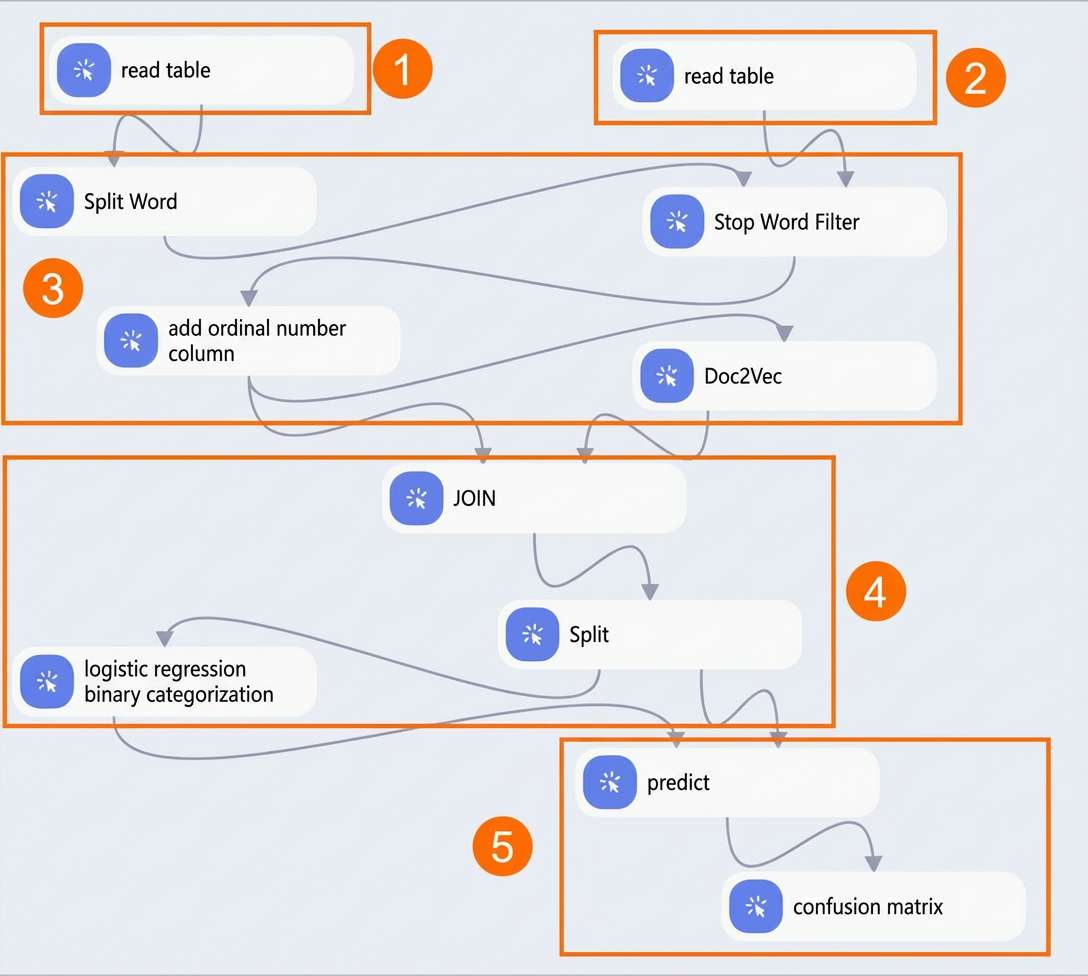
Designer automatically builds the pipeline from the preset template, as shown below.
Section
Description
①
Data source, which is the review data.
②
Stopwords. This section filters out words such as auxiliary verbs and punctuation. You must manually upload a stopword list. For example, the stop_word list contains entries such as
$,0through9,?, and_.③
Text vectorization. The Doc2Vec algorithm converts each review into a semantic vector. Each vector row represents the meaning of a review. After the pipeline runs, you can right-click Doc2Vec on the canvas and choose to view the text vector table.
④
Generate a classification model. First, a splitting component splits the vectorized text into a training dataset and a test dataset. Then, a logistic regression algorithm uses the training dataset to train a binary classification model. This model can determine whether a review is positive or negative.
⑤
A confusion matrix evaluates the model's performance.
-
-
Run the pipeline and view the results.
-
Click the Run icon
 at the top of the canvas.
 -
After the pipeline finishes running, right-click the Confusion Matrix component on the canvas and click Visual Analysis from the shortcut menu.
-
In the Confusion Matrix section, click the Summary tab to view the model evaluation statistics.
-