This topic shows you how to use a Designer preset template to quickly build a model for predicting power plant output.
Background
This workflow uses data from a combined-cycle power plant to demonstrate a machine learning application in an industrial setting. Accurate power output predictions enable operators to better plan and schedule power generation, which optimizes resource allocation and prevents waste.
Prerequisites
-
You have created a workspace. For more information, see Create and manage workspaces.
-
You have associated MaxCompute resources with your workspace. For more information, see Create and manage workspaces.
Dataset
This workflow uses the Combined Cycle Power Plant dataset from the UCI Machine Learning Repository. For more information, see Combined Cycle Power Plant Data Set. The dataset contains 9,568 data samples. Each sample includes five features: Ambient Temperature (AT), Exhaust Vacuum (V), Ambient Pressure (AP), Relative Humidity (RH), and Net Hourly Electrical Energy Output (PE). The following figure shows a sample of the workflow data.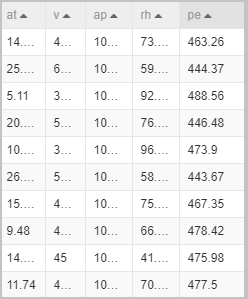
Predict power plant output
Go to the Machine Learning Designer page.
Log on to the PAI console.
In the left-side navigation pane, click Workspaces. On the Workspaces page, click the name of the workspace that you want to manage.
In the left-side navigation pane, choose .
-
Build the workflow.
-
On the Designer page, click the Preset Templates tab.
-
Click Create on the Power Plant Output Power Prediction preset template card.
-
In the Create Pipeline dialog box, configure the parameters (you can use the default values for all parameters).
The Data Storage parameter specifies the OSS bucket path used to store temporary data and models that the workflow generates.
-
Click Confirm.
The workflow is created in about 10 seconds.
-
In the workflow list, double-click the Power Plant Output Power Prediction workflow to enter the workflow.
-
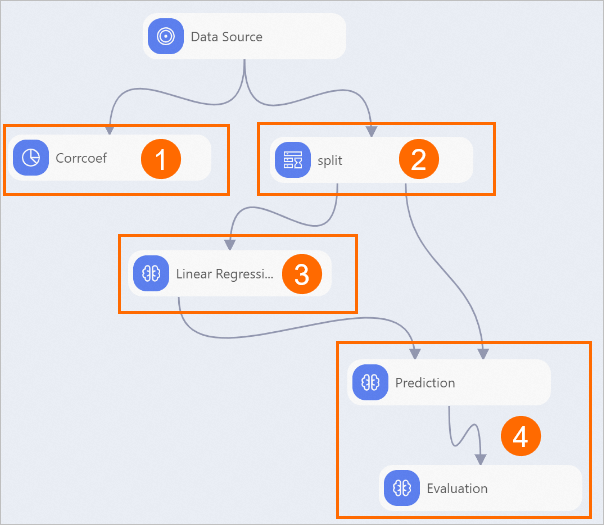
The system automatically builds a workflow based on a preset template, as shown in the figure below.
Area
Description
①
The Correlation Matrix component lets you observe the impact of each feature on the power output (PE). After the workflow runs, you can right-click the Correlation Matrix component on the canvas and click Visual Analysis to view the results.
②
The dataset is split into a training dataset and a prediction dataset at a ratio of 8:2.
③
The Linear Regression component builds a regression model.
④
The Predicted component tests the model's performance on the prediction dataset. The Regression Evaluation component then evaluates the model's prediction accuracy.
-
-
Run the workflow and view the output.
-
Click
 in the upper-left corner of the canvas.
 -
After the workflow finishes running, right-click the Correlation Matrix on the canvas, and on the shortcut menu, click Visual Analysis.
-
In the Correlation Matrix dialog box, view the influence of each feature on the output power PE.
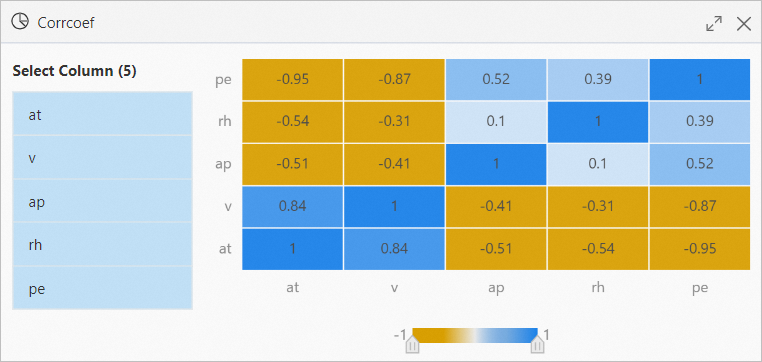 The features are ranked by their impact on power output (PE) from most to least significant: Ambient Temperature (AT), Exhaust Vacuum (V), Ambient Pressure (AP), and Relative Humidity (RH).
 -
Right-click Linear Regression on the canvas, and from the shortcut menu, click to view the model evaluation results.
-
Right-click Regression Evaluation on the canvas, and on the shortcut menu, click to evaluate the performance of the regression algorithm model based on the output.
-