Modularity measures the strength of community structure in a network by comparing the density of edges within communities to edges between communities. A modularity value above 0.3 indicates a strong community structure. Machine Learning Designer provides the Modularity component to compute this value for any graph.
Use cases
Evaluate clustering quality: After running a community detection algorithm (such as Louvain or K-means on graphs), use the Modularity component to score how well the detected communities are separated.
Compare community detection results: Run Modularity on multiple partitioning outcomes to identify which produces the most meaningful community structure.
Detect meaningful groups: Determine whether a graph (such as a social network or transaction graph) contains significant community structure before applying further analysis.
Prerequisites
Before you begin, ensure that you have:
An active PAI workspace with access to Machine Learning Designer
An input edge table with source vertex, source group, target vertex, and target group columns
Configure the component
Method 1: Use the PAI console
Log on to the PAI console and go to Visualized Modeling (Designer).
Open a pipeline, then drag the Modularity component onto the canvas.
Configure the parameters in the right-side pane.
Fields setting
| Parameter | Description |
|---|---|
| Source Vertex Column | The column containing source vertices in the edge list |
| Initial Vertex Label Column | The group each source vertex belongs to |
| Target Vertex Column | The column containing target vertices in the edge list |
| Target Vertex Label Column | The group each target vertex belongs to |
Tuning
| Parameter | Default | Description |
|---|---|---|
| Number of Workers | — | The number of workers to run in parallel. Higher values increase communication overhead. |
| Worker Memory (MB) | 4096 | Maximum memory per worker, in MB. Exceeding this limit throws an OutOfMemory exception. |
Method 2: Use PAI commands
Run the following command in the SQL Script component. For details on how to run PAI commands from the SQL Script component, see Execute PAI commands within the SQL Script component.
PAI -name Modularity
    -project algo_public
    -DinputEdgeTableName=Modularity_func_test_edge
    -DfromVertexCol=flow_out_id
    -DfromGroupCol=group_out_id
    -DtoVertexCol=flow_in_id
    -DtoGroupCol=group_in_id
    -DoutputTableName=Modularity_func_test_result;
Parameters
| Parameter | Required | Default | Description |
|---|---|---|---|
inputEdgeTableName | Yes | — | The name of the input edge list |
inputEdgeTablePartitions | No | Full list | The partitions to read from the input edge list |
fromVertexCol | Yes | — | The column containing source vertices |
fromGroupCol | Yes | — | The group each source vertex belongs to |
toVertexCol | Yes | — | The column containing target vertices |
toGroupCol | Yes | — | The group each target vertex belongs to |
outputTableName | Yes | — | The name of the output table |
outputTablePartitions | No | — | The partitions in the output table |
lifecycle | No | — | The lifecycle of the output table |
workerNum | No | — | The number of workers to run in parallel. Higher values increase communication overhead. |
workerMem | No | 4096 | Maximum memory per worker, in MB. Exceeding this limit throws an OutOfMemory exception. |
splitSize | No | 64 | The size of each data split, in MB |
Example
This example creates a graph with two well-separated communities and computes its modularity score.
In the SQL Script component's right-side pane, clear the Use Script Mode and Whether the system adds a create table statement checkboxes before running these steps.
Add a SQL Script component and paste the following SQL into the editor to create the input edge table. The test graph has eight nodes split into two communities: nodes 1–4 (group 3) and nodes 5–8 (group 7). Edges connect nodes within each group densely, with only one cross-community edge between nodes 4 and 6.
Corresponding graph data structure: 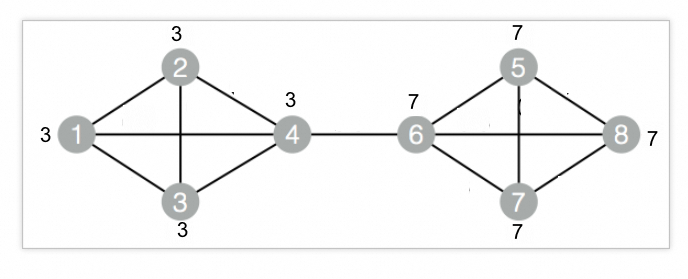
drop table if exists Modularity_func_test_edge;
create table Modularity_func_test_edge as
select * from
(
    select '1' as flow_out_id,'3' as group_out_id,'2' as flow_in_id,'3' as group_in_id
    union all
    select '1' as flow_out_id,'3' as group_out_id,'3' as flow_in_id,'3' as group_in_id
    union all
    select '1' as flow_out_id,'3' as group_out_id,'4' as flow_in_id,'3' as group_in_id
    union all
    select '2' as flow_out_id,'3' as group_out_id,'3' as flow_in_id,'3' as group_in_id
    union all
    select '2' as flow_out_id,'3' as group_out_id,'4' as flow_in_id,'3' as group_in_id
    union all
    select '3' as flow_out_id,'3' as group_out_id,'4' as flow_in_id,'3' as group_in_id
    union all
    select '4' as flow_out_id,'3' as group_out_id,'6' as flow_in_id,'7' as group_in_id
    union all
    select '5' as flow_out_id,'7' as group_out_id,'6' as flow_in_id,'7' as group_in_id
    union all
    select '5' as flow_out_id,'7' as group_out_id,'7' as flow_in_id,'7' as group_in_id
    union all
    select '5' as flow_out_id,'7' as group_out_id,'8' as flow_in_id,'7' as group_in_id
    union all
    select '6' as flow_out_id,'7' as group_out_id,'7' as flow_in_id,'7' as group_in_id
    union all
    select '6' as flow_out_id,'7' as group_out_id,'8' as flow_in_id,'7' as group_in_id
    union all
    select '7' as flow_out_id,'7' as group_out_id,'8' as flow_in_id,'7' as group_in_id
)tmp
;
Add another SQL Script component, paste the following commands into the editor, then connect it to the component from the previous step.
drop table if exists ${o1};
PAI -name Modularity
    -project algo_public
    -DinputEdgeTableName=Modularity_func_test_edge
    -DfromVertexCol=flow_out_id
    -DfromGroupCol=group_out_id
    -DtoVertexCol=flow_in_id
    -DtoGroupCol=group_in_id
    -DoutputTableName=${o1};
Run the pipeline. After it completes, right-click the SQL Script component from the previous step and choose View Data > SQL Script Output to view the result.
| val                 |
| ------------------- |
| 0.42307692766189575 |
The
valcolumn is the modularity score (Q value). A value of approximately 0.42 confirms a strong community structure in this graph, consistent with the two visually distinct groups in the test data.
What's next
To detect communities automatically before scoring them, combine the Modularity component with a community detection component such as Label Propagation or Louvain.
To learn how to build and run pipelines in Machine Learning Designer, see Use Machine Learning Designer to build a pipeline.