Label Propagation Classification is a semi-supervised learning algorithm that classifies unlabeled nodes in a graph by spreading label information from labeled nodes through the graph structure. Use it when you have a small number of labeled data points and want to classify a much larger set of unlabeled points based on their structural similarity to labeled ones.
How it works
The algorithm builds a graph where each node is a data point and each edge represents the similarity between two nodes. Labels spread through the graph according to edge weights: a label moves easily across strongly connected nodes (high similarity) but has difficulty crossing weakly connected regions (low similarity). This means nodes in a dense cluster converge to the same label, while sparse connections act as natural barriers between groups.
The propagation follows these steps:
-
Initialize: labeled nodes start with their known labels; unlabeled nodes start with no assignment.
-
Propagate: in each iteration, every node updates its label distribution based on the weighted labels of its neighbors.
-
Anchor: labeled nodes are pinned — their labels never change during propagation, ensuring they remain the source of truth.
-
Converge: iterations continue until label distributions stabilize (change falls below the convergence coefficient) or the maximum number of iterations is reached.
-
Classify: after convergence, each node is assigned the category with the highest probability in its label distribution.
Configure the component
Method 1: Configure the component on the pipeline page
Add the Label Propagation Classification component on the pipeline page of Machine Learning Designer in the Platform for AI (PAI) console. The following table describes the parameters.
| Tab | Parameter | Description |
|---|---|---|
| Fields Setting | Vertex Table: Vertex Column | The vertex column in the vertex table. |
| Vertex Table: Label Column | The vertex label column in the vertex table. | |
| Vertex Table: Weight Column | The vertex weight column in the vertex table. | |
| Edge Table: Source Vertex Column | The start vertex column in the edge table. | |
| Edge Table: Target Vertex Column | The end vertex column in the edge table. | |
| Edge Table: Select Weight Column | The edge weight column in the edge table. | |
| Parameters Setting | Maximum Number of Iterations | The maximum number of iterations. Default value: 30. |
| Damping Coefficient | The damping coefficient. Default value: 0.8. | |
| Convergence Coefficient | The threshold for detecting convergence. The algorithm stops when the change in label distributions falls below this value. Default value: 0.000001. | |
| Tuning | Number of Workers | The number of vertices for parallel job execution. Higher values increase parallelism but also increase framework communication overhead. |
| Worker Memory (MB) | The maximum memory allocated to a single worker. Default value: 4096 MB. If memory usage exceeds this limit, an OutOfMemory error is reported. |
Method 2: Configure the component by using PAI commands
Run the Label Propagation Classification component using PAI commands in the SQL Script component. For more information, see Scenario 4: Execute PAI commands within the SQL script component in the "SQL Script" topic.
PAI -name LabelPropagationClassification
    -project algo_public
    -DinputEdgeTableName=LabelPropagationClassification_func_test_edge
    -DfromVertexCol=flow_out_id
    -DtoVertexCol=flow_in_id
    -DinputVertexTableName=LabelPropagationClassification_func_test_node
    -DvertexCol=node
    -DvertexLabelCol=label
    -DoutputTableName=LabelPropagationClassification_func_test_result
    -DhasEdgeWeight=true
    -DedgeWeightCol=edge_weight
    -DhasVertexWeight=true
    -DvertexWeightCol=label_weight
    -Dalpha=0.8
    -Depsilon=0.000001;
The following table describes all PAI command parameters.
| Parameter | Required | Default value | Description |
|---|---|---|---|
inputEdgeTableName |
Yes | — | Name of the input edge table. |
inputEdgeTablePartitions |
No | Full table | Partitions in the input edge table. |
fromVertexCol |
Yes | — | Start vertex column in the input edge table. |
toVertexCol |
Yes | — | End vertex column in the input edge table. |
inputVertexTableName |
Yes | — | Name of the input vertex table. |
inputVertexTablePartitions |
No | Full table | Partitions in the input vertex table. |
vertexCol |
Yes | — | Vertex column in the input vertex table. |
vertexLabelCol |
Yes | — | Vertex label column in the input vertex table. |
outputTableName |
Yes | — | Name of the output table. |
outputTablePartitions |
No | — | Partitions in the output table. |
lifecycle |
No | — | Lifecycle of the output table. |
workerNum |
No | — | The number of vertices for parallel job execution. Higher values increase parallelism but also increase framework communication overhead. |
workerMem |
No | 4096 | Maximum memory per worker (MB). An OutOfMemory error is reported if usage exceeds this value. |
splitSize |
No | 64 | Data split size (MB). |
hasEdgeWeight |
No | false | Whether edges in the input edge table have weights. Set to true to use edge weights during propagation. |
edgeWeightCol |
No | — | Edge weight column in the input edge table. |
hasVertexWeight |
No | false | Whether vertices in the input vertex table have weights. Set to true to use vertex weights during propagation. |
vertexWeightCol |
No | — | Vertex weight column in the input vertex table. |
alpha |
No | 0.8 | The damping coefficient. |
epsilon |
No | 0.000001 | The convergence coefficient. The algorithm stops when label distribution changes fall below this threshold. |
maxIter |
No | 30 | Maximum number of iterations. |
Example
This example creates a small graph with two labeled nodes (a with label X, d with label Y) and two unlabeled nodes (b and c), then runs label propagation to classify b and c.
-
Add the SQL Script component. Deselect Use Script Mode and Whether the system adds a create table statement. Enter the following SQL statements to create the edge and vertex tables.
Data structure 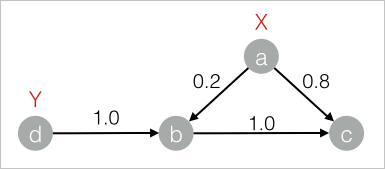
drop table if exists LabelPropagationClassification_func_test_edge; create table LabelPropagationClassification_func_test_edge as select * from ( select 'a' as flow_out_id, 'b' as flow_in_id, 0.2 as edge_weight union all select 'a' as flow_out_id, 'c' as flow_in_id, 0.8 as edge_weight union all select 'b' as flow_out_id, 'c' as flow_in_id, 1.0 as edge_weight union all select 'd' as flow_out_id, 'b' as flow_in_id, 1.0 as edge_weight )tmp ; drop table if exists LabelPropagationClassification_func_test_node; create table LabelPropagationClassification_func_test_node as select * from ( select 'a' as node,'X' as label, 1.0 as label_weight union all select 'd' as node,'Y' as label, 1.0 as label_weight )tmp; -
Add another SQL Script component. Deselect Use Script Mode and Whether the system adds a create table statement. Enter the following PAI command and connect this component to the one from step 1.
drop table if exists ${o1}; PAI -name LabelPropagationClassification -project algo_public -DinputEdgeTableName=LabelPropagationClassification_func_test_edge -DfromVertexCol=flow_out_id -DtoVertexCol=flow_in_id -DinputVertexTableName=LabelPropagationClassification_func_test_node -DvertexCol=node -DvertexLabelCol=label -DoutputTableName=${o1} -DhasEdgeWeight=true -DedgeWeightCol=edge_weight -DhasVertexWeight=true -DvertexWeightCol=label_weight -Dalpha=0.8 -Depsilon=0.000001; -
Click
 in the upper left corner to run the pipeline.
 -
Right-click the SQL Script component from step 2 and choose View Data > SQL Script Output to view the results.
-
Node
a(labeled X) and noded(labeled Y) retain their original labels with full confidence (weight = 1.0). -
Node
cis classified as X with approximately 54% probability, meaning it is more likely in X's category. -
Node
bis classified as Y with approximately 83% probability, pulled more strongly towarddthrough the high-weight edge fromdtob(weight 1.0).
| node | tag | weight              |
| ---- | --- | ------------------- |
| a    | X   | 1.0                 |
| c    | X   | 0.5370370370370371  |
| c    | Y   | 0.4629629629629629  |
| b    | X   | 0.16666666666666666 |
| b    | Y   | 0.8333333333333333  |
| d    | Y   | 1.0                 |
The output contains one row per label per node. The
weightcolumn shows the probability that a node belongs to that label's category. In this example: -