You can define custom monitoring metrics based on your business logic and use them for auto scaling. For example, you can scale a service based on the number of invalid data points received per second. EAS provides a real-time metric reporting API and a complete pipeline for data collection, storage, visualization, and auto scaling. You only need to add logic to your code to periodically report custom metrics and declare them when you deploy the service. After deployment, EAS receives the service's custom metric data through this pipeline and displays it on the Service Monitoring page.
Limitations
-
Only QPS and CPU utilization are supported as built-in metrics for auto scaling.
-
The
metricsfield is supported only when you deploy a service by using a custom image or a custom processor.
Step 1: Configure an API to report metrics
Before you deploy a service, you must prepare a custom image or a custom processor. In your code, configure your custom metrics and the API to report them periodically. For more information, see Custom Images or Custom Processors.
For example, the endpoint for the POST request implemented in your code is http://localhost:8080/api/builtin/realtime_metrics, and the request body is as follows:
[
    {
        "name": "qps",
        "tags": {
            "status": "200"
        },
        "value": 20
    },
    {
        "name": "qps",
        "tags": {
            "status": "400"
        },
        "value": 13
    }
]
The preceding example reports a metric named qps. The average QPS for status code 200 is 20, and the average QPS for status code 400 is 13. In simple scenarios where you do not need to categorize or subdivide metrics by using tags, you can omit the tags field:
[
    {
        "name": "qps",
        "value": 20
    }
]
You must write code to periodically call this API and report your custom metrics.
Step 2: Deploy the service
After you define your custom metrics, you must declare them in the metrics field of the service configuration file during deployment. The EAS framework uses this declaration to initialize the service and build the monitoring dashboard. The following steps describe the procedure:
-
Prepare the service configuration JSON file.
Add a
metricsfield to the file to declare the metric name, type, and other information. The following example shows a JSON file for deploying a service by using a custom image:{ "name": "metrics_test", "containers": [ { "image": "registry-vpc.cn-chengdu.aliyuncs.com/eas/eas-image-****:metrics", "command": "python3 -u /image.py", "port": 5000 } ], "metrics": [ { "name": "qps", "tags": "status" } ], "metadata": { "instance": 1, "cpu": 2, "memory":1000 } }The image parameter is set to the custom image that you prepared. The following table describes the fields in the metrics field. For information about other parameters, see JSON Deployment.
Parameter
Required
Description
name
Yes
The name of the custom metric that your service reports.
-
EAS creates a monitoring dashboard on the Service Monitoring page based on this name.
-
This name is used to specify the reference metric when you configure auto scaling.
tags
No
The name of the tag for the metric. You can use tags to create subdivisions of a metric. For example, you can categorize the
qpsmetric by status code.This configuration deploys a service based on a Docker image, allowing you to build your business logic with a custom image. The
metricsfield declares a metric namedqpsand a tag namedstatus. The tag allows you to categorize data for the same metric. For example, you can use thestatustag to record the number of requests for different status codes, such asstatus=200andstatus=400. -
-
Deploy the model service by using the configuration file.
-
Go to the service deployment page. For more information, see Custom Deployment.
-
In the Configuration Editor section, click JSON Deployment and paste the content of your prepared JSON file into the editor.
-
Click Deploy.
-
Step 3: View the metrics
After the service is deployed, it periodically reports custom metric data based on your code logic. The EAS framework provides a local API to receive this data.
-
EAS uses this real-time data for auto scaling.
-
In the data pipeline, information is not displayed in real time. The pipeline aggregates data, resulting in minute-level granularity on the monitoring page.
The following steps describe how to view the custom qps metric:
-
On the EAS-Online Model Services page, click a service name to open the Service Details page.
-
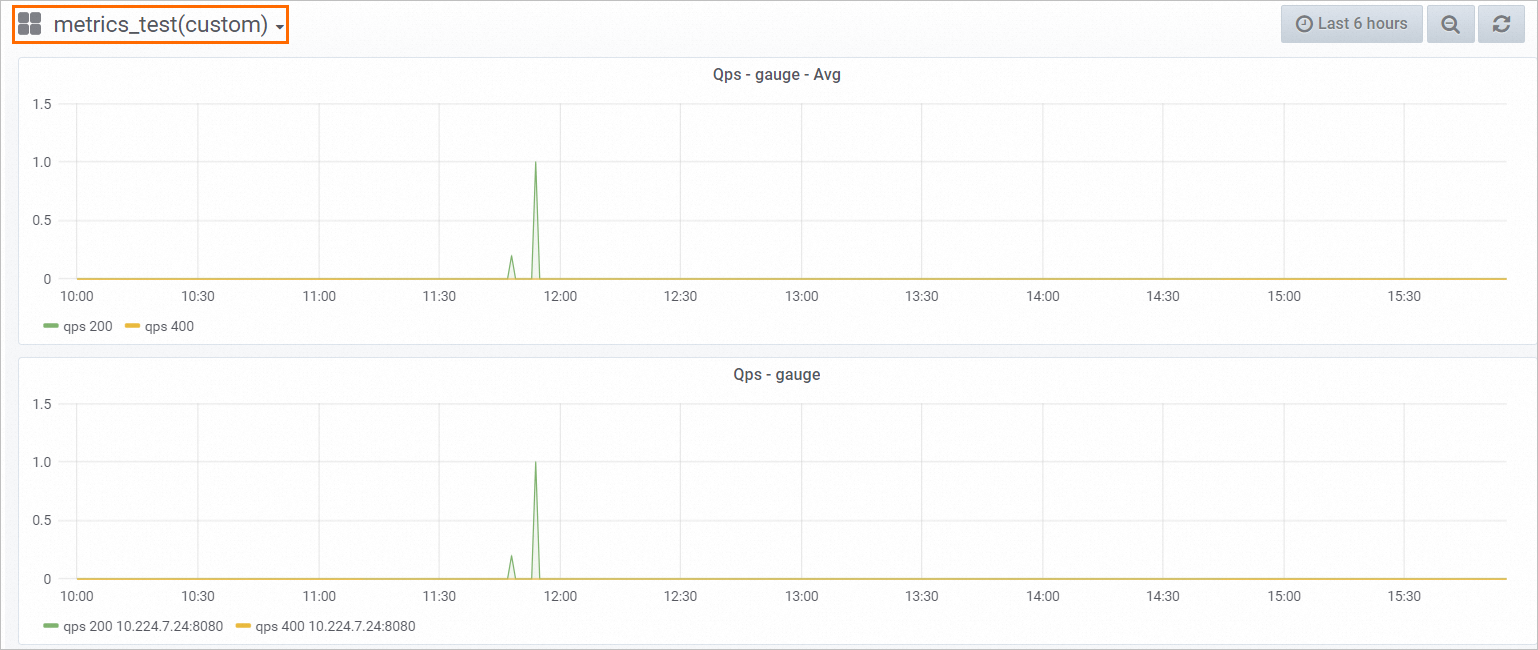
Click the Service Monitoring tab. In the upper-left corner of the page, select the custom panel.
This panel displays the monitoring data for your custom metric in two parts:
-
The average metric data across all instances in the service.
-
The metric data for each individual instance in the service.
-
Step 4: Configure auto scaling
You can enable auto scaling for the service based on custom metrics. The procedure is the same as for built-in metrics. For more information, see horizontal auto scaling.
The following examples show how to configure auto scaling based on the qps custom metric:
-
Use eascmd to enable auto scaling. For more information about the operations and parameters, see horizontal auto scaling.
-
If the custom metric does not require a tag:
eascmd autoscale service_name -Dmin=1 -Dmax=10 -Dstrategies.custom[qps]=3This configuration scales out the service when the average
qpsmetric exceeds 3, and scales in when the value falls below 3. -
If the custom metric needs to be specified at the tag level:
eascmd autoscale service_name -Dmin=1 -Dmax=10 -Dstrategies.custom[qps]@status[200]=3This configuration scales out the service when the average
qpsmetric for the series wherestatusis200exceeds 3, and scales in when the value falls below 3.
-
-
Use the console to enable auto scaling. For more information about the operations and parameters, see horizontal auto scaling.
-
If a configured custom metric does not need to report tags, you need to set the variable name to custom[qps] and the variable value to 3 in the Custom Scaling Metric section of the Auto Scaling Settings dialog box. In the Auto Scaling Settings dialog box, set Minimum Instances to
1and Maximum Instances to10. In the Custom Scaling Metric area, set the variable name tocustom[qps]and the variable value to3, and then click Enable. -
If the custom metric needs to be specified at the tag level, in the Auto Scaling Settings dialog box, under Custom Scaling Metric, set the variable name to custom[qps]@status[200] and its value to 3.
-