EAS automatically checks GPU compute power and node communication health for large-scale distributed deployments.
Applicable scope
This feature applies to multi-node distributed inference services deployed on Lingjun resources.
Key concepts
-
Detection timing:
-
Before instance startup: Runs before the application in the service instance (Pod) starts. Detects hardware or network issues to prevent startup failures.
-
During instance runtime: Runs as a background process alongside the service.
-
-
Check item:
-
Before instance startup: Compute performance check, node communication check, and cross-check for computing and communication.
-
During instance runtime: Only C4D (GPU health check).
-
For details about check items, see Appendix: Check items.
-
-
Abnormal state handling:
-
Instance startup failure: If an issue is detected, the system terminates the current instance startup.
-
No action: The system only records an event without taking other action.
-
Procedure
Enable and configure compute monitoring
-
Log on to the PAI console. Select a region on the top of the page. Then, select the desired workspace and click Enter Elastic Algorithm Service (EAS).
-
Click Deploy Service. In the Custom Model Deployment section, click Custom Deployment.
-
In the Features section, under Stability Guarantee, enable Compute monitoring & fault tolerance. In the panel that appears, configure the check parameters. To use a JSON file instead, see Appendix: JSON file parameters.
NoteBoth "Before running" and "Instance running" checks can be added.
-
Configure pre-run check (optional):
-
Detection timing: Select Before running.
-
Check item: Select check items as needed, such as Run Compute Performance Check and Run Node Communication Check. By default, GPU GEMM, All-Reduce (single-node), and All-Reduce (between two nodes) are enabled.
-
Set an appropriate timeout based on estimated durations in Check items. Checks run sequentially. The default timeout is 5 minutes. A check that exceeds this time is treated as a failure.
-
Abnormal state handling: The default is Instance startup failed. Select Rebuild Instance based on your disaster recovery policy.
-
-
Configure in-run check (optional):
-
Detection timing: Select Instance running.
-
Check item: Only C4D is available.
-
Abnormal state handling: Only Ignore is available.
-
-
View check results
After configuring this feature, view the check reports in either of the following ways:
-
Method 1: From the instance list
-
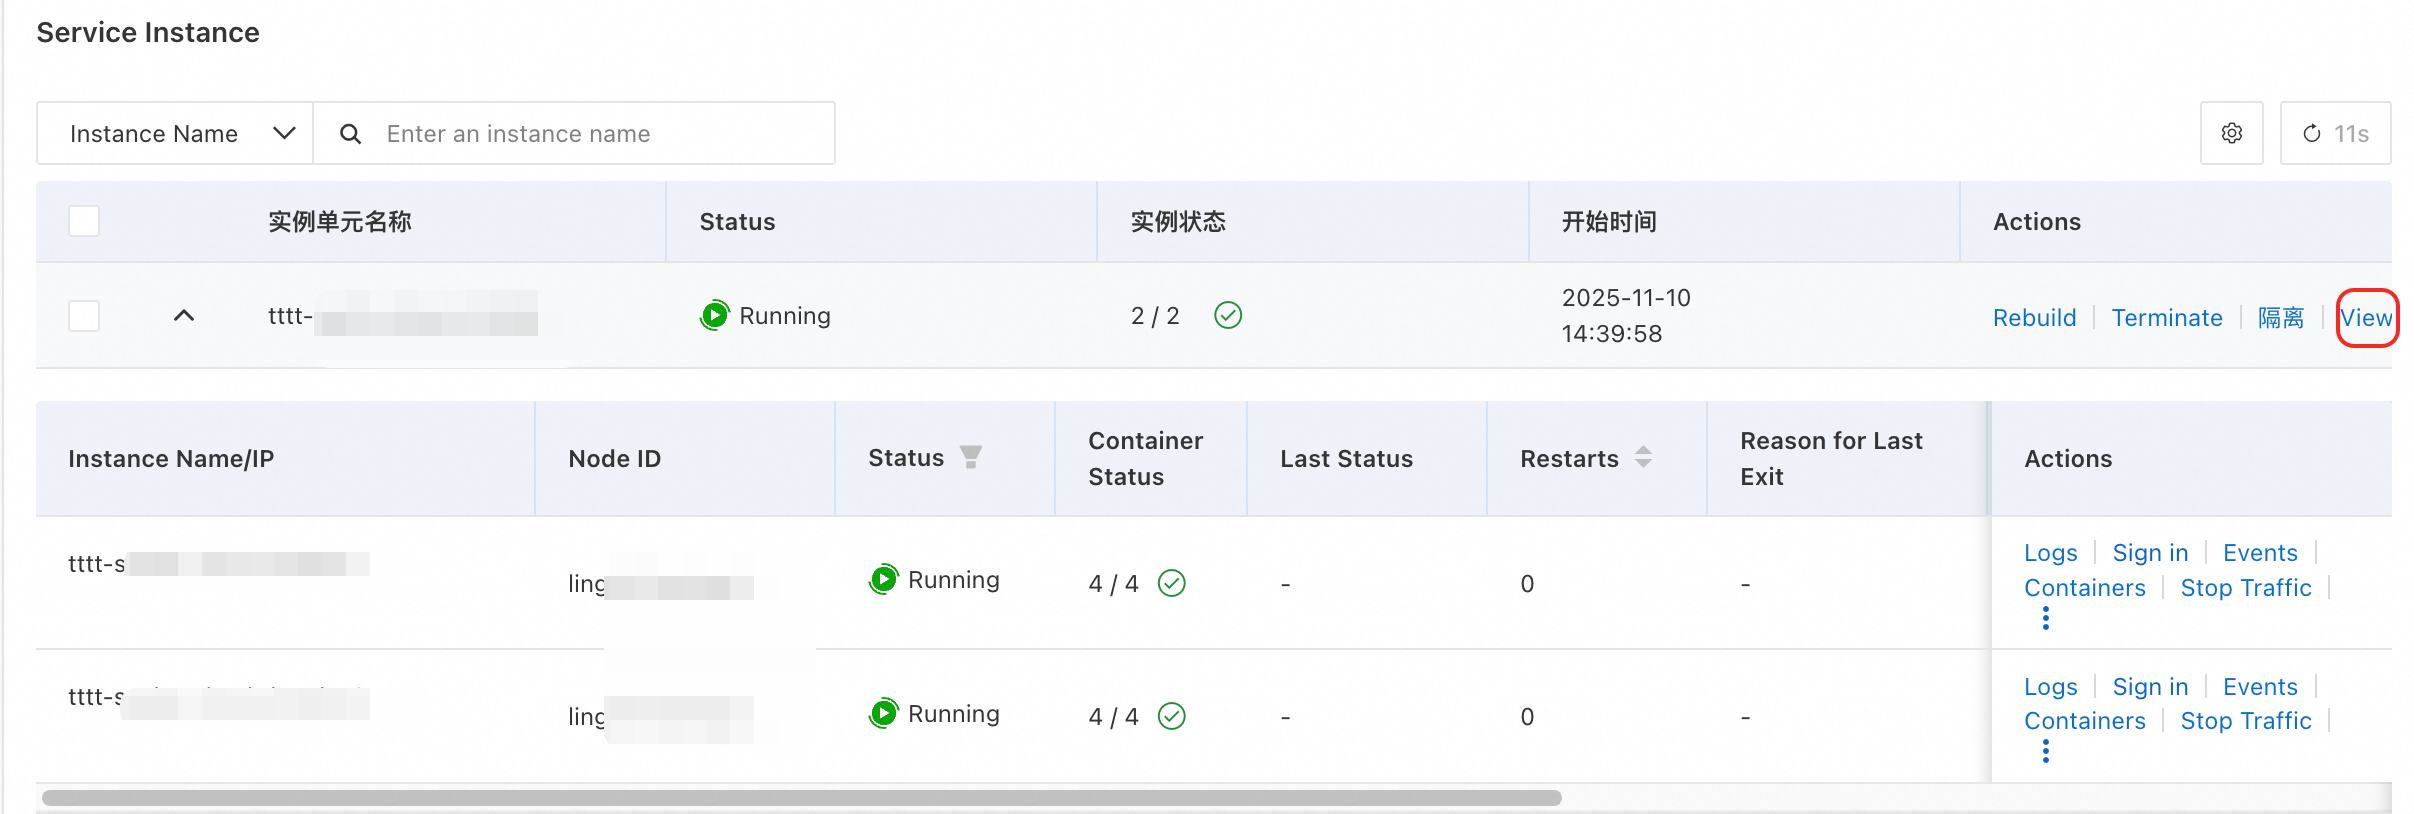
On the service details page, go to the Overview tab.
-
In Service Instance, find the target instance and click View results in the Actions column.
-
-
Method 2: From deployment events
-
On the service details page, go to the Deployment Events tab.
-
Find an event of type
SanityCheckSucceededorSanityCheckFailedand click View results in the Actions column.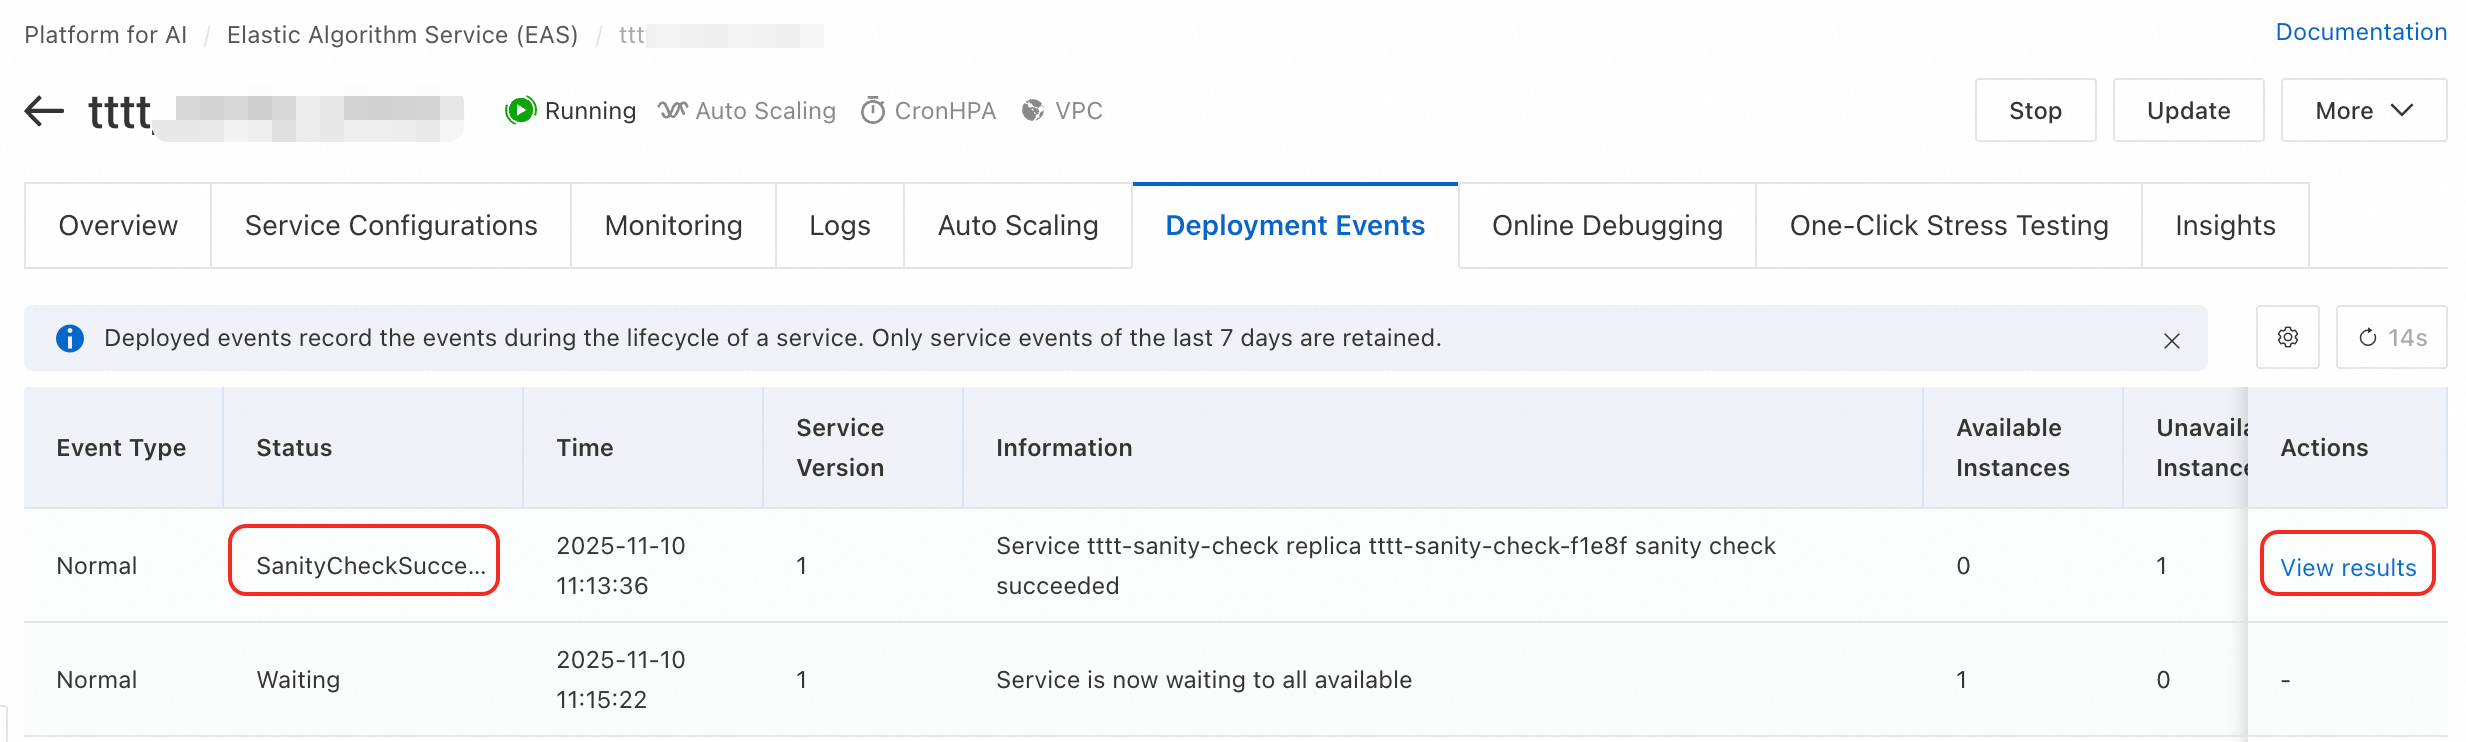
-
The Health check results drawer appears. View detailed reports for each check item.
FAQ
What are the common causes for an All-Reduce check failure?
An All-Reduce check failure usually indicates network communication issues such as high latency, severe packet loss, or incorrect Remote Direct Memory Access (RDMA) configuration between nodes. Use the detailed data in the report to troubleshoot nodes with slow communication.
Appendix: Check items
|
Check item |
Description |
Estimated duration |
|
|
Before instance startup |
|||
|
Compute performance check |
GPU GEMM |
Checks GPU GEMM performance to identify:
|
1 minute |
|
GPU Kernel Launch |
Checks GPU kernel launch latency to identify:
|
1 minute |
|
|
Node communication check |
All-Reduce |
Checks node communication performance across different patterns to identify:
|
Per collective communication check: 5 minutes |
|
All-to-All |
|||
|
All-Gather |
|||
|
Multi-All-Reduce |
|||
|
PyTorch-Gloo |
Checks node communication through PyTorch Gloo to identify faulty nodes. |
1 minute |
|
|
Network Connectivity |
Checks network connectivity of head or tail nodes to identify connectivity issues. |
2 minutes |
|
|
Cross-check for computing and communication |
MatMul/All-Reduce Overlap |
Checks single-node performance when communication and computation kernels overlap to identify:
|
1 minute |
|
During instance runtime |
|||
|
C4D |
Checks GPU health during instance runtime. |
||
Appendix: JSON file parameters
Configuration example
{
    "aimaster": {
        "runtime_check": {
            "fail_action": "retain",
            "micro_benchmarks": "c4d"
        },
        "sanity_check": {
            "fail_action": "retain",
            "micro_benchmarks": "gemm_flops,all_reduce_1,all_reduce_2,kernel_launch,all_reduce,all_to_all_2,all_gather_2,all_gather,multi_all_reduce_2,multi_all_reduce,pytorch_gloo_2,network_connectivity,comp_comm_overlap",
            "timeout": 100
        }
    }
}
Parameters
|
Parameter |
Description |
||
|
aimaster |
runtime_check Checks performed during instance runtime. |
fail_action |
Action to take when an abnormal state is detected. |
|
micro_benchmarks |
Check item. Valid value: C4D. |
||
|
sanity_check Checks performed before instance startup. |
fail_action |
Action to take when an abnormal state is detected. |
|
|
micro_benchmarks |
Check items. Separate multiple items with commas. |
||
|
timeout |
Maximum check duration, in minutes. |
||