The SkyWalking NGINX Lua module instruments NGINX and reports trace data to the Managed Service for OpenTelemetry console. After traces flow into the console, you can view application topology, individual traces, abnormal and slow transactions, and SQL analysis.
Background information
SkyWalking is a popular application performance monitoring (APM) service developed in China, designed for microservices, cloud-native architectures, and container-based architectures such as Docker, Kubernetes, and Mesos. SkyWalking is also a distributed tracing system.
SkyWalking provides auto-instrument agents for frameworks such as Dubbo, gRPC, JDBC, OkHttp, Spring, Tomcat, Struts, and Jedis. You can also manually instrument applications based on the OpenTracing standard. This topic describes how to use the SkyWalking NGINX Lua module to automatically instrument NGINX and report trace data.
Pick a deployment method based on your environment:
| Method | Best for | Effort |
|---|---|---|
| Pre-built Docker image (recommended) | Quick evaluation or proof-of-concept | Low |
| Custom Dockerfile | Customized container builds in CI/CD pipelines | Medium |
| Bare-metal ECS instance | Non-containerized environments running CentOS | High |
All three methods require a SkyWalking endpoint from the Managed Service for OpenTelemetry console. Get the endpoint before you begin.
Get a SkyWalking endpoint
Retrieve a SkyWalking reporting endpoint from the Managed Service for OpenTelemetry console. Steps differ between the new and old console versions.
New console
Log on to the Managed Service for OpenTelemetry console. In the left-side navigation pane, click Integration Center.
On the Integration Center page, click the SkyWalking card in the Open Source Frameworks section.
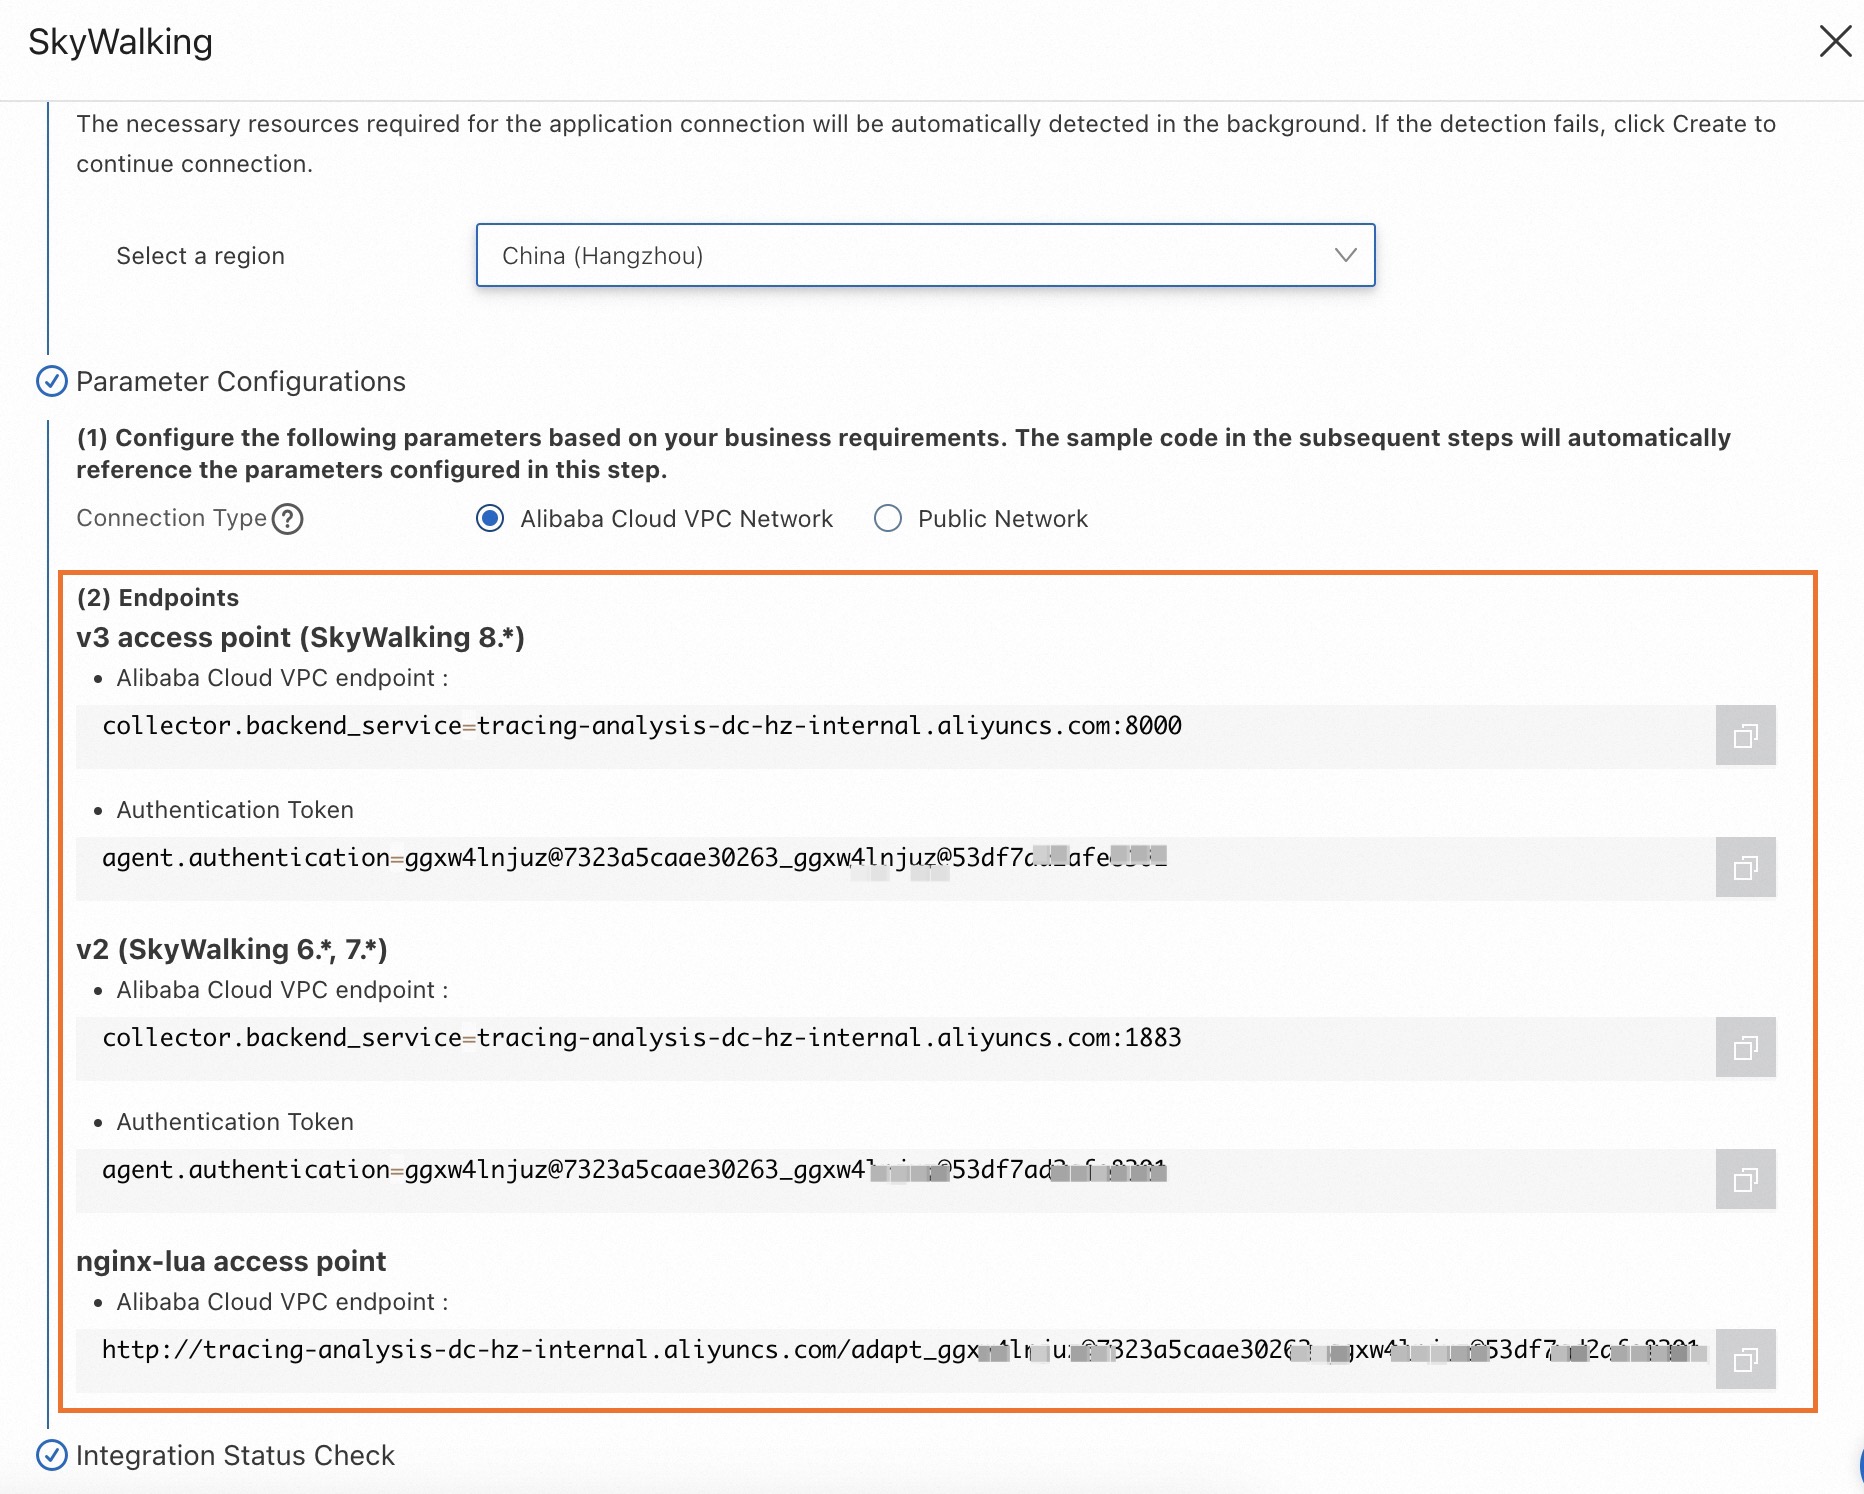
In the SkyWalking panel, click the Start Integration tab and select the region where you want to report data.
Note: When you access a region for the first time, resources are automatically initialized.
Set Connection Type and copy the endpoint.
If your service runs on Alibaba Cloud in the selected region, select Alibaba Cloud VPC Network.
Otherwise, select Public Network.
Old console
Log on to the Managed Service for OpenTelemetry console.
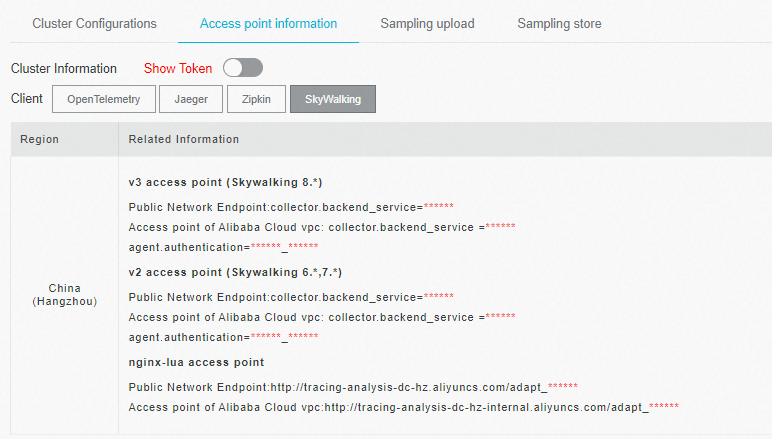
In the left-side navigation pane, click Cluster Configurations. On the page that appears, click the Access point information tab.
In the top navigation bar, select the region where you want to report data. In the Cluster Information section, turn on Show Token.
Set Client to SkyWalking. In the Related Information column, copy the endpoint.
Note: If your application runs in an Alibaba Cloud production environment, use a VPC endpoint. Otherwise, use a public endpoint.
Deploy with a pre-built Docker image
Use the pre-built image from Container Registry to run an instrumented NGINX container in minutes.
Pull the image.
docker pull registry.cn-hangzhou.aliyuncs.com/public-community/skywalking-nginx-lua:0.2Start the container. Replace
<your-skywalking-endpoint>with the endpoint you copied in Get a SkyWalking endpoint. Example with a sample endpoint:docker run --rm -p 80:80 \ -e "BACKEND_URL=<your-skywalking-endpoint>" \ -d registry.cn-hangzhou.aliyuncs.com/public-community/skywalking-nginx-lua:0.2docker run --rm -p 80:80 \ -e "BACKEND_URL=http://tracing-analysis-dc-hz.aliyuncs.com/skywalking/adapt_123@abc_456@efg/api" \ -d registry.cn-hangzhou.aliyuncs.com/public-community/skywalking-nginx-lua:0.2Verify that NGINX is running: A successful response returns the NGINX configuration.
Open
http://localhost/nginx.confin a browser, orRun
curl "localhost/nginx.conf"from the command line.
Continue to Verify trace reporting to confirm that traces reach the console.
Build a custom Docker image
Build a custom image from the provided Dockerfile when you need to extend or modify the NGINX configuration.
Download and extract the Dockerfile package.
   wget https://arms-apm.oss-cn-hangzhou.aliyuncs.com/demo/nginx-skywalking-docker.tgz
   tar -xzvf nginx-skywalking-docker.tgz
   cd nginx-lua
Build the image.
docker build --rm --tag skywalking-nginx-lua:0.2 .Start the container. Replace
<your-skywalking-endpoint>with the endpoint you copied in Get a SkyWalking endpoint. Example with a sample endpoint:docker run --rm -p 80:80 \ -e "BACKEND_URL=<your-skywalking-endpoint>" \ -d skywalking-nginx-lua:0.2docker run --rm -p 80:80 \ -e "BACKEND_URL=http://tracing-analysis-dc-hz.aliyuncs.com/skywalking/adapt_123@abc_456@efg/api" \ -d skywalking-nginx-lua:0.2Verify that NGINX is running: A successful response returns the NGINX configuration.
Open
http://localhost/nginx.confin a browser, orRun
curl "localhost/nginx.conf"from the command line.
Continue to Verify trace reporting to confirm that traces reach the console.
Install on an ECS instance
Install and configure the SkyWalking NGINX Lua module directly on an Elastic Compute Service (ECS) instance. The following steps use CentOS 7.0 as an example.
Step 1: Set up the Lua runtime
Install build dependencies.
   yum install gcc gcc-c++ kernel-devel -y
   yum install readline-devel -y
   yum install ncurses-devel -y
Download and install Lua 5.3.5.
   cd /usr/local/src
   wget http://www.lua.org/ftp/lua-5.3.5.tar.gz
   tar -zxvf lua-5.3.5.tar.gz
   cd /usr/local/src/lua-5.3.5 && echo "INSTALL_TOP= /usr/local/lua_5.3.5" >> Makefile && make linux && make install
Download and install LuaRocks. The following example uses LuaRocks 2.2.2.
   cd /usr/local/src
   wget https://luarocks.github.io/luarocks/releases/luarocks-2.2.2.tar.gz
   tar -xzvf luarocks-2.2.2.tar.gz
   cd luarocks-2.2.2
   ./configure --prefix=/usr/local/luarocks_2.2.2 --with-lua=/usr/local/lua_5.3.5
   make build
   make install
Add the following lines to
/etc/profile:export LUA_HOME=/usr/local/lua_5.3.5 export LUAROCKS_HOME=/usr/local/luarocks_2.2.2 PATH=$PATH:$HOME/bin:$LUAROCKS_HOME/bin:$LUA_HOME/bin export PATH export LUA_PATH="$LUAROCKS_HOME/share/lua/5.3/?.lua;?.lua;;" export LUA_CPATH="$LUAROCKS_HOME/lib/lua/5.3/?.so;?.so;;"Apply the environment variables.
source /etc/profileInstall required Lua packages.
   luarocks install luasocket
   luarocks install lua-resty-jit-uuid
   luarocks install luaunit
   luarocks install lua-cjson 2.1.0-1
Verify the installation. The output lists the four packages you installed:
luasocket,lua-resty-jit-uuid,luaunit, andlua-cjson.luarocks list
Step 2: Install OpenResty NGINX
Install dependencies and build OpenResty.
   yum install pcre-devel openssl-devel gcc curl postgresql-devel
   cd /usr/local/src
   wget -c https://openresty.org/download/openresty-1.15.8.1rc2.tar.gz
   tar -zxvf openresty-1.15.8.1rc2.tar.gz
   cd openresty-1.15.8.1rc2
   ./configure --prefix=/usr/local/openresty/ \
     --with-http_stub_status_module \
     --with-luajit \
     --without-http_redis2_module \
     --with-http_iconv_module \
     --with-http_postgres_module \
     --with-stream \
     && gmake && gmake install
Add OpenResty to your
PATH.export PATH=/usr/local/openresty/nginx/sbin:$PATH
Step 3: Install and configure the SkyWalking NGINX Lua module
Download and extract the SkyWalking NGINX Lua module. The following example uses version 1.0.1.
   cd /usr/local/skywalking-nginx-lua
   wget https://mirrors.tuna.tsinghua.edu.cn/apache/skywalking/nginx-lua/1.0.1/skywalking-nginx-lua-1.0.1-src.tgz
   tar -xzvf skywalking-nginx-lua-1.0.1-src.tgz
Open the
nginx.conffile and update the following settings. Replace<your-skywalking-endpoint>with the endpoint you copied in Get a SkyWalking endpoint. ExamplestartBackendTimervalue:Setting Value Description lua_package_path/usr/local/skywalking-nginx-lua/lib/?.lua;;Path to the SkyWalking Lua libraries startBackendTimerrequire("skywalking.client"):startBackendTimer("<your-skywalking-endpoint>")Reporting endpoint require("skywalking.client"):startBackendTimer("http://tracing-analysis-dc-hz.aliyuncs.com/skywalking/adapt_***/api")Start NGINX with the SkyWalking configuration.
nginx -c /usr/local/skywalking-nginx-lua/examples/nginx.confContinue to Verify trace reporting to confirm that traces reach the console.
Verify trace reporting
After you finish any of the deployment methods above, confirm that trace data reaches the console:
Generate trace data by sending a few requests to NGINX:
curl http://localhostLog on to the Managed Service for OpenTelemetry console.
On the Applications page, click your application name.
On the application details page, verify that traces, application topology, and monitoring metrics appear.