Istio sidecar proxies generate distributed traces for every request that passes through the service mesh. By forwarding these traces through the OpenTelemetry Collector to Managed Service for OpenTelemetry, you can visualize service dependencies, identify latency bottlenecks, and trace requests end-to-end across services.
How it works
Each Istio sidecar proxy (istio-proxy) automatically creates a span for every inbound and outbound request. These spans are exported to an OpenTelemetry Collector deployed in your cluster, which then forwards them to Managed Service for OpenTelemetry.
Application Pod          OpenTelemetry          Managed Service for
(istio-proxy) ──OTLP──> Collector ──OTLP──> OpenTelemetryIstio proxies generate individual spans but cannot correlate spans across services on their own. Your applications must propagate trace context headers so that spans from different services are joined into a single end-to-end trace. See Propagate trace context headers.
Prerequisites
Istio v1.19 or later installed in the cluster
The OpenTelemetry Collector deployed in the cluster. Istio trace data must pass through the Collector before reaching Managed Service for OpenTelemetry. For deployment instructions, see Forwarding via OpenTelemetry Collector
The endpoint and authentication token for Managed Service for OpenTelemetry. For details, see Connect to Managed Service for OpenTelemetry and authenticate clients
Step 1: Configure the trace exporter
Istio exports trace data to the OpenTelemetry Collector via OTLP over either gRPC or HTTP. Choose a transport protocol based on your environment.
Option A: gRPC (OTLP/gRPC)
Create a file named istio-otel-config.yaml:
apiVersion: install.istio.io/v1alpha1
kind: IstioOperator
spec:
  meshConfig:
    defaultConfig:
      tracingServiceName: APP_LABEL_AND_NAMESPACE
    enableTracing: true
    extensionProviders:
    - name: otel-tracing
      opentelemetry:
        port: 4317
        service: <service-name>.<namespace>.svc.cluster.local
        resource_detectors:
          environment: {}
Option B: HTTP (OTLP/HTTP)
Create a file named istio-otel-config.yaml:
apiVersion: install.istio.io/v1alpha1
kind: IstioOperator
spec:
  meshConfig:
    defaultConfig:
      tracingServiceName: APP_LABEL_AND_NAMESPACE
    enableTracing: true
    extensionProviders:
    - name: otel-tracing
      opentelemetry:
        port: 4318
        service: opentelemetry-collector.observability.svc.cluster.local
        http:
          path: "/v1/traces"
          timeout: 5s
          headers:
            - name: "custom-header"
              value: "custom value"
        resource_detectors:
          environment: {}
Replace the placeholders with your actual values:
| Placeholder | Description | Example |
|---|---|---|
<service-name> | Service name of the OpenTelemetry Collector | opentelemetry-collector |
<namespace> | Namespace where the Collector is deployed | observability |
tracingServiceName controls how Istio generates the service name attached to each span:
| Value | Format | Example |
|---|---|---|
APP_LABEL_AND_NAMESPACE (default) | <app label>.<namespace> | productpage.default |
CANONICAL_NAME_ONLY | Workload name only | productpage |
CANONICAL_NAME_AND_NAMESPACE | <canonical name>.<namespace> | productpage.default |
Apply the configuration:
istioctl install -y -f istio-otel-config.yamlStep 2: Enable tracing and set the sampling rate
Create a Telemetry resource to enable trace collection and set the sampling rate.
Create a file named istio-telemetry.yaml:
apiVersion: telemetry.istio.io/v1
kind: Telemetry
metadata:
  name: otel-demo
spec:
  tracing:
  - providers:
    - name: otel-tracing
    randomSamplingPercentage: 100
Apply the configuration:
kubectl apply -f istio-telemetry.yamlrandomSamplingPercentage accepts values from 0 to 100. A value of 100 records traces for all requests. In production, adjust this value based on your traffic volume to balance observability with overhead. During initial testing, set it to 100 to confirm that traces flow correctly.
Step 3: Propagate trace context headers
Istio proxies automatically create spans, but your applications must forward trace context headers from incoming requests to all outgoing requests. Without header propagation, spans from different services appear as disconnected traces instead of a single end-to-end trace.
Forward these headers in every service-to-service call:
| Header | Purpose |
|---|---|
traceparent | W3C Trace Context standard -- carries the trace ID and span ID |
tracestate | W3C Trace Context standard -- carries vendor-specific trace data |
x-request-id | Envoy-specific header used for consistent log and trace sampling |
Most OpenTelemetry SDKs handle propagation automatically when properly initialized. If your application does not use an OpenTelemetry SDK, extract these headers from each incoming request and include them in all outgoing HTTP requests triggered by that incoming request.
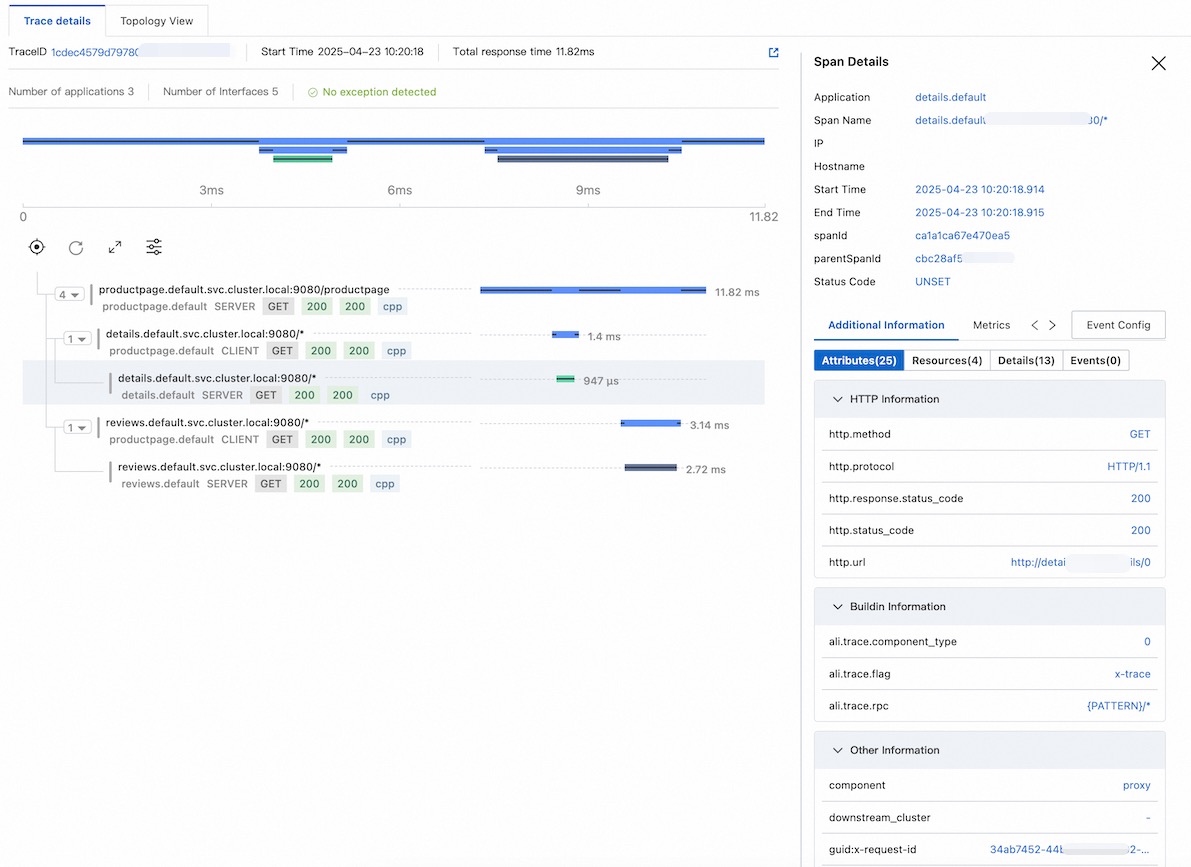
Step 4: View trace data
After traffic flows between services, open the Managed Service for OpenTelemetry console to view traces.

End-to-end walkthrough
The following walkthrough covers setting up Istio, the OpenTelemetry Collector, and a demo application from scratch, then verifies that traces appear in the Managed Service for OpenTelemetry console.
1. Install Istio
curl -L https://istio.io/downloadIstio | sh -

cd istio-1.25.2

export PATH=$PWD/bin:$PATH
2. Deploy the OpenTelemetry Collector
Replace <gRPC-Endpoint> and <gRPC-Token> with the values obtained in Prerequisites.
Create otel.yaml:
apiVersion: v1
kind: ConfigMap
metadata:
  name: opentelemetry-collector-conf
  labels:
    app: opentelemetry-collector
data:
  opentelemetry-collector-config: |
    receivers:
      otlp:
        protocols:
          grpc:
          http:
    processors:
      batch:
    exporters:
      otlp:
        endpoint: "<gRPC-Endpoint>"
        headers:
          Authentication: "<gRPC-Token>"
        tls:
          insecure: true
      logging:
        loglevel: debug
    extensions:
      health_check:
        port: 13133
    service:
      extensions:
      - health_check
      pipelines:
        logs:
          receivers: [otlp]
          processors: [batch]
          exporters: [logging]
        traces:
          receivers:
          - otlp
          exporters:
          - logging
          - otlp
---
apiVersion: v1
kind: Service
metadata:
  name: opentelemetry-collector
  labels:
    app: opentelemetry-collector
spec:
  ports:
    - name: grpc-opencensus
      port: 55678
      protocol: TCP
      targetPort: 55678
    - name: grpc-otlp       # Default endpoint for OpenTelemetry gRPC receiver
      port: 4317
      protocol: TCP
      targetPort: 4317
    - name: http-otlp        # HTTP endpoint for OpenTelemetry receiver
      port: 4318
      protocol: TCP
      targetPort: 4318
  selector:
    app: opentelemetry-collector
---
apiVersion: apps/v1
kind: Deployment
metadata:
  name: opentelemetry-collector
spec:
  selector:
    matchLabels:
      app: opentelemetry-collector
  strategy:
    rollingUpdate:
      maxSurge: 1
      maxUnavailable: 1
    type: RollingUpdate
  template:
    metadata:
      labels:
        app: opentelemetry-collector
        sidecar.istio.io/inject: "false"    # Disable sidecar injection for the Collector.
                                             # The Collector must receive trace data directly
                                             # from Istio proxies without an intermediary sidecar.
    spec:
      containers:
        - command:
            - "/otelcol"
            - "--config=/conf/opentelemetry-collector-config.yaml"
          env:
            - name: POD_NAME
              valueFrom:
                fieldRef:
                  apiVersion: v1
                  fieldPath: metadata.name
            - name: POD_NAMESPACE
              valueFrom:
                fieldRef:
                  apiVersion: v1
                  fieldPath: metadata.namespace
          image: otel/opentelemetry-collector:0.54.0
          imagePullPolicy: IfNotPresent
          name: opentelemetry-collector
          ports:
            - containerPort: 4317
              protocol: TCP
            - containerPort: 4318
              protocol: TCP
            - name: grpc-opencensus
              containerPort: 55678
              protocol: TCP
          resources:
            limits:
              cpu: "2"
              memory: 4Gi
            requests:
              cpu: 200m
              memory: 400Mi
          terminationMessagePath: /dev/termination-log
          terminationMessagePolicy: File
          volumeMounts:
            - name: opentelemetry-collector-config-vol
              mountPath: /conf
      dnsPolicy: ClusterFirst
      restartPolicy: Always
      schedulerName: default-scheduler
      terminationGracePeriodSeconds: 30
      volumes:
        - configMap:
            defaultMode: 420
            items:
              - key: opentelemetry-collector-config
                path: opentelemetry-collector-config.yaml
            name: opentelemetry-collector-conf
          name: opentelemetry-collector-config-vol
Create the namespace and deploy the Collector:
kubectl create namespace observability

kubectl apply -f otel.yaml -n observability
3. Configure Istio tracing
Configure the trace data exporter and enable tracing. This example uses OTLP/gRPC.
# Configure the exporter
cat <<EOF | istioctl install -y -f -
apiVersion: install.istio.io/v1alpha1
kind: IstioOperator
spec:
  meshConfig:
    enableTracing: true
    extensionProviders:
    - name: otel-tracing
      opentelemetry:
        port: 4317
        service: opentelemetry-collector.observability.svc.cluster.local
        resource_detectors:
          environment: {}
EOF

# Enable tracing with 100% sampling
kubectl apply -f - <<EOF
apiVersion: telemetry.istio.io/v1
kind: Telemetry
metadata:
  name: otel-demo
spec:
  tracing:
  - providers:
    - name: otel-tracing
    randomSamplingPercentage: 100
EOF
4. Deploy the demo application
Enable automatic sidecar injection for the default namespace, then deploy the Bookinfo sample application:
# Enable sidecar injection -- Istio automatically injects the istio-proxy
# container into every new Pod in this namespace
kubectl label namespace default istio-injection=enabled

# Deploy the Bookinfo application (run from the Istio directory)
kubectl apply -f samples/bookinfo/platform/kube/bookinfo.yaml
Verify that all Pods are running and each has the istio-proxy sidecar:
kubectl get pods
kubectl get services
Confirm the application responds:
kubectl exec "$(kubectl get pod -l app=ratings -o jsonpath='{.items[0].metadata.name}')" \
  -c ratings -- curl -sS productpage:9080/productpage | grep -o "<title>.*</title>"

# Expected output:
# <title>Simple Bookstore App</title>
5. Expose the demo application
Create an ingress gateway and retrieve the external address:
# Create the ingress gateway
kubectl apply -f samples/bookinfo/networking/bookinfo-gateway.yaml

# Retrieve the ingress IP and port
export INGRESS_NAME=istio-ingressgateway
export INGRESS_NS=istio-system

export INGRESS_HOST=$(kubectl -n "$INGRESS_NS" get service "$INGRESS_NAME" \
  -o jsonpath='{.status.loadBalancer.ingress[0].ip}')
export INGRESS_PORT=$(kubectl -n "$INGRESS_NS" get service "$INGRESS_NAME" \
  -o jsonpath='{.spec.ports[?(@.name=="http2")].port}')
export SECURE_INGRESS_PORT=$(kubectl -n "$INGRESS_NS" get service "$INGRESS_NAME" \
  -o jsonpath='{.spec.ports[?(@.name=="https")].port}')
export TCP_INGRESS_PORT=$(kubectl -n "$INGRESS_NS" get service "$INGRESS_NAME" \
  -o jsonpath='{.spec.ports[?(@.name=="tcp")].port}')

export GATEWAY_URL=$INGRESS_HOST:$INGRESS_PORT

echo $GATEWAY_URL
# Example output: 192.168.1.100:80
For details on determining the ingress IP and ports, see the Istio ingress documentation.
Verify external access:
curl -s "http://${GATEWAY_URL}/productpage" | grep -o "<title>.*</title>"

# Expected output:
# <title>Simple Bookstore App</title>
6. View trace data
Generate test traffic and view the results:
# Send 10 requests to generate traces
for i in $(seq 1 10); do curl -s -o /dev/null "http://$GATEWAY_URL/productpage"; done
Open the Managed Service for OpenTelemetry console to view the traces.
FAQ
No trace data appears in the console
If traces are not visible after sending traffic, work through these checks:
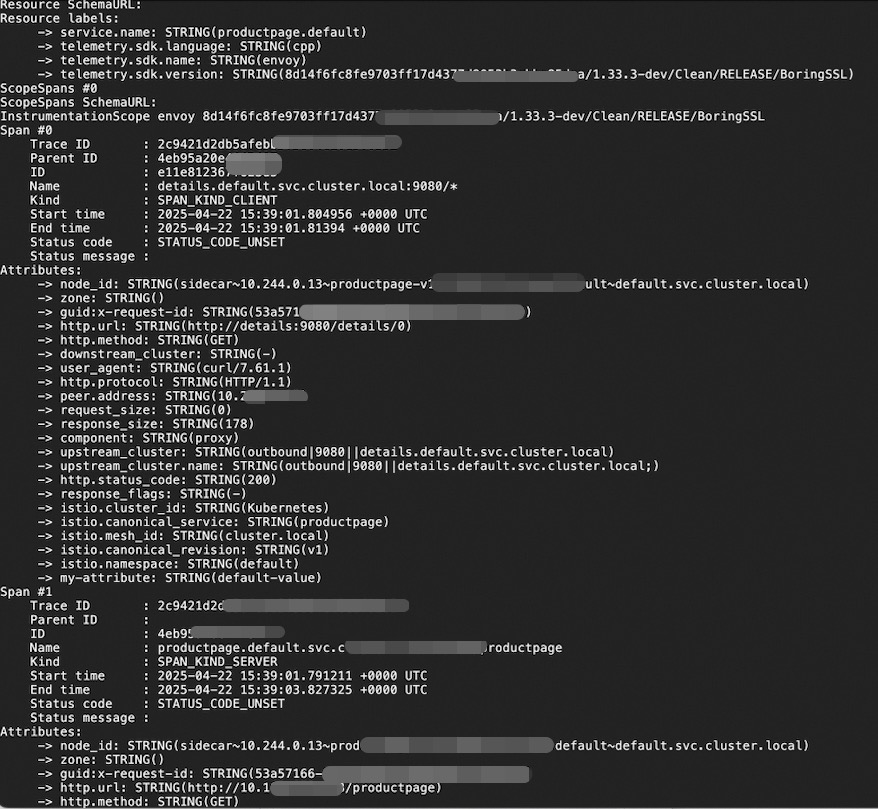
1. Verify the OpenTelemetry Collector is receiving data
Check the Collector logs for incoming trace data:
kubectl logs <collector-pod-name> -n <namespace>The logs should show entries confirming that trace data is received and exported. If nothing appears, verify the service address in your IstioOperator configuration.
2. Confirm sidecar injection
Verify that each application Pod contains the istio-proxy container:
kubectl get pod -n default -o custom-columns=NAME:.metadata.name,CONTAINERS:.spec.containers[*].nameIf istio-proxy does not appear in the CONTAINERS column, sidecar injection failed. This typically happens when the istio-injection=enabled label was added after the Pods were already running. Automatic injection only applies to new Pods. Restart existing Pods to trigger injection:
kubectl rollout restart deployment -n default3. Check the Telemetry resource
Confirm that the Telemetry resource is configured correctly:
kubectl get telemetry otel-demo -o yaml4. Verify the Istio mesh configuration
Confirm that the OpenTelemetry extension provider is registered in the Istio ConfigMap:
kubectl get cm istio -n istio-system -o yaml | grep -A 10 extensionProviders5. Check trace context propagation
If traces appear but are disconnected (each service shows isolated spans), your applications are not forwarding trace context headers. Verify that every service propagates the traceparent, tracestate, and x-request-id headers. See Step 3: Propagate trace context headers.