NGINX is a free, open source, and high-performance server that serves as an HTTP server and a reverse proxy. When NGINX proxies requests to your microservices, a slow upstream response can affect users without any visibility into the scope of the impact. Distributed tracing on the NGINX proxy layer captures per-request timing data so you can identify bottlenecks and measure the number of affected page views. You can instrument NGINX with Jaeger and report trace data to Managed Service for OpenTelemetry using Docker, an ECS instance, or a non-Alibaba Cloud environment.
How it works
The OpenTracing NGINX module intercepts every proxied request and creates a Jaeger span. A Jaeger agent running alongside NGINX forwards the spans to the Managed Service for OpenTelemetry backend over gRPC.
Client request
      |
      v
+----------------------------+
|  NGINX + OpenTracing       |--- span data ---> Jaeger Agent ---> Managed Service
|  module                    |                                     for OpenTelemetry
+----------------------------+
      |
      v
  Upstream service
Each request generates a trace that includes the NGINX proxy span. If the upstream service is also instrumented, the trace covers the full end-to-end request path.
Prerequisites
Get a Jaeger or Zipkin endpoint from the Managed Service for OpenTelemetry console. All three deployment options require this endpoint.
Log on to the Managed Service for OpenTelemetry console.
In the left-side navigation pane, click Cluster Configurations. Then, click the Access point information tab.
In the top navigation bar, select a region. In the Cluster Information section, turn on Show Token.
In the Client section, click Jaeger or Zipkin.
Copy the endpoint from the Related Information column.
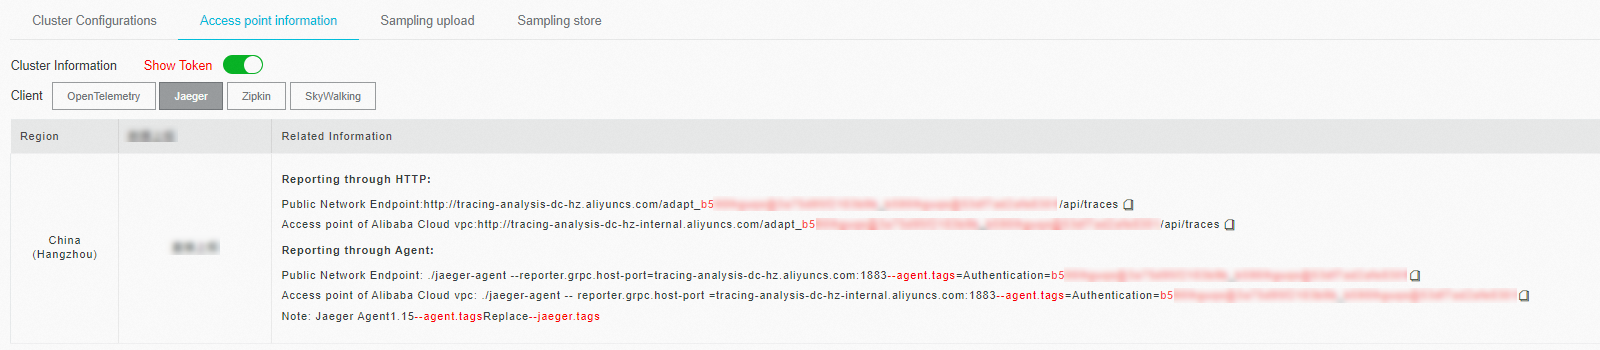
Use a Virtual Private Cloud (VPC) endpoint for applications deployed in an Alibaba Cloud production environment. Use a public endpoint for all other environments. For Zipkin, use the v2 endpoint by default. Use v1 only if your application specifically requires it.
Choose a deployment option
| Option | Best for |
|---|---|
| Docker (quick start) | Fast local testing and evaluation |
| ECS instance | Production deployments on Alibaba Cloud |
| Non-Alibaba Cloud environments | On-premises or other cloud providers |
Deploy in a Docker container
This option packages NGINX with the Jaeger tracing module in a single container. Use it to verify that trace data flows to the Managed Service for OpenTelemetry backend.
Download and build the Docker image:
   wget https://arms-apm.oss-cn-hangzhou.aliyuncs.com/demo/nginx-jaeger-docker.tgz
   tar -xzvf nginx-jaeger-docker.tgz
   cd nginx-jaeger
   docker build --rm --tag nginx-jaeger:0.1 .
Start the container. Replace the environment variables with the endpoint values from Prerequisites: Example with actual values:
Variable Description Example <grpc-host>gRPC endpoint host and port tracing-analysis-dc-hz.aliyuncs.com:1883<grpc-auth>Authentication token 123abc@123abc_789abc@456abc}docker run --rm -p 80:80 \ -e "GRPC_HOST=<grpc-host>" \ -e "GRPC_AUTH=<grpc-auth>" \ -d jaeger-nginx:0.1docker run --rm -p 80:80 \ -e "GRPC_HOST=tracing-analysis-dc-hz.aliyuncs.com:1883" \ -e "GRPC_AUTH=123abc@123abc_789abc@456abc}" \ -d jaeger-nginx:0.1Send a test request to generate trace data:
curl "http://localhost"
Deploy on an ECS instance
This option compiles NGINX from source with OpenTracing support and configures Jaeger for production use. It gives you full control over NGINX configuration and the Jaeger sampling strategy.
Install NGINX
Download and extract the NGINX source code:
   wget http://nginx.org/download/nginx-1.14.2.tar.gz
   tar -xzvf nginx-1.14.2.tar.gz
Compile and install NGINX with dynamic module support: NGINX is installed to
/usr/local/nginx/.cd nginx-1.14.2 ./configure --with-compat make sudo make install
Install the OpenTracing module
Download and extract the OpenTracing dynamic module:
   wget https://github.com/opentracing-contrib/nginx-opentracing/releases/download/v0.7.0/linux-amd64-nginx-1.14.0-ngx_http_module.so.tgz
   tar -xzvf linux-amd64-nginx-1.14.0-ngx_http_module.so.tgz
Copy the module to the NGINX modules directory:
   sudo mkdir -p /usr/local/nginx/modules
   sudo cp ngx_http_opentracing_module.so /usr/local/nginx/modules/ngx_http_opentracing_module.so
Configure Jaeger tracing
Download the Jaeger client plugin:
   wget https://github.com/jaegertracing/jaeger-client-cpp/releases/download/v0.4.2/libjaegertracing_plugin.linux_amd64.so
   sudo cp /usr/local/lib/libjaegertracing_plugin.so /usr/local/lib/libjaegertracing.so
Edit
/usr/local/nginx/conf/nginx.confto load the OpenTracing module and enable tracing: The following table describes the key directives:NoteFor the full directive reference, see the nginx-opentracing documentation.
Directive Description opentracing onEnables the OpenTracing module globally opentracing_load_tracerLoads the Jaeger plugin and its configuration file opentracing_operation_name $uriSets the span name to the request URI opentracing_trace_locations offDisables tracing for internal NGINX redirects opentracing_propagate_contextForwards trace context headers to the upstream service load_module modules/ngx_http_opentracing_module.so; events {} http { opentracing on; opentracing_load_tracer /usr/local/lib/libjaegertracing_plugin.so /etc/jaeger-config.json; server { error_log /var/log/nginx/debug.log debug; listen 80; location ~ { opentracing_operation_name $uri; opentracing_trace_locations off; # Replace with your upstream service address. proxy_pass http://127.0.0.1:8081; opentracing_propagate_context; } } }Create the Jaeger configuration file at
/etc/jaeger-config.json:Parameter Description service_nameThe service name displayed in the tracing console sampler.typeSampling strategy. constwithparam: 1samples every requestsampler.paramSampling parameter. 1= sample all;0= sample nonereporter.localAgentHostPortAddress of the local Jaeger agent { "service_name": "nginx", "sampler": { "type": "const", "param": 1 }, "reporter": { "localAgentHostPort": "localhost:6831" } }
Start the Jaeger agent
Choose one of the following methods based on your Jaeger setup:
Option A: Self-managed Jaeger
Download the native Jaeger agent and start it with your collector endpoint:
nohup ./jaeger-agent --collector.host-port=<collector-host>:<port> 1>1.log 2>2.log &Option B: Managed Service for OpenTelemetry (recommended)
Download the Tracing Analysis agent and start it with the endpoint from Prerequisites. Remove /api/traces from the end of the endpoint before using it here.
nohup ./tracing-analysis-agent-linux-amd64 \
--collector.host-port=<endpoint> 1>1.log 2>2.log &| Variable | Description | Example |
|---|---|---|
<endpoint> | Endpoint without the /api/traces suffix | http://tracing-analysis-dc-sh.aliyuncs.com/adapt_abc123@abc123_efg123@efg123 |
Start NGINX and test
Start NGINX:
sudo /usr/local/nginx/sbin/nginxSend a test request:
curl "http://localhost"
Deploy in non-Alibaba Cloud environments
Use this option for on-premises or third-party cloud deployments. It pulls a pre-built container image from Alibaba Cloud Container Registry, so no source compilation is needed.
Pull the pre-built image:
docker pull registry.cn-hangzhou.aliyuncs.com/public-community/jaeger-nginx:0.1Start the container. Replace the environment variables with the endpoint values from Prerequisites:
Variable Description Example <grpc-host>gRPC endpoint host and port tracing-analysis-dc-hz.aliyuncs.com:1883<grpc-auth>Authentication token 123abc@123abc_789abc@456abc}docker run --rm -p 80:80 \ -e "GRPC_HOST=<grpc-host>" \ -e "GRPC_AUTH=<grpc-auth>" \ -d registry.cn-hangzhou.aliyuncs.com/public-community/jaeger-nginx:0.1Confirm NGINX is running. Open a browser and go to
http://localhost/nginx.conf, or run:curl "http://localhost/nginx.conf"
Verify the results
Log on to the Managed Service for OpenTelemetry console.
On the Applications page, click the name of your application (for example,
nginx).Confirm that trace data appears on the application details page. Each trace represents one proxied request through NGINX.
Troubleshooting
No trace data in the console
Check the agent process. Confirm the Jaeger agent or Tracing Analysis agent is running. Review the agent logs (
1.log,2.log) for connection errors.Verify the endpoint. The endpoint must match the region where your application is deployed. For the managed agent, remove
/api/tracesfrom the endpoint.Check NGINX error logs. Look for OpenTracing module errors in
/var/log/nginx/debug.log. Common causes include an incorrect path to the Jaeger plugin.sofile.Confirm network connectivity. For VPC endpoints, the ECS instance and the Managed Service for OpenTelemetry backend must be in the same VPC. For public endpoints, verify outbound access on port 1883 (gRPC).
Traces appear but spans are missing
Check sampling configuration. In
/etc/jaeger-config.json, confirmsampler.paramis set to1to sample all requests during testing.Verify context propagation. The
opentracing_propagate_contextdirective must be present in the NGINXlocationblock to forward trace context headers to upstream services.