The metric exploration feature of Managed Service for OpenTelemetry provides metric data for you to analyze and optimize your business performance.
Prerequisite
Application telemetry data is reported to Managed Service for OpenTelemetry. For more information, see Integrate services or components.
Procedure
Log on to the Managed Service for OpenTelemetry console.
In the left-side navigation pane, choose .
On the page that appears, add query sets based on your business requirements.
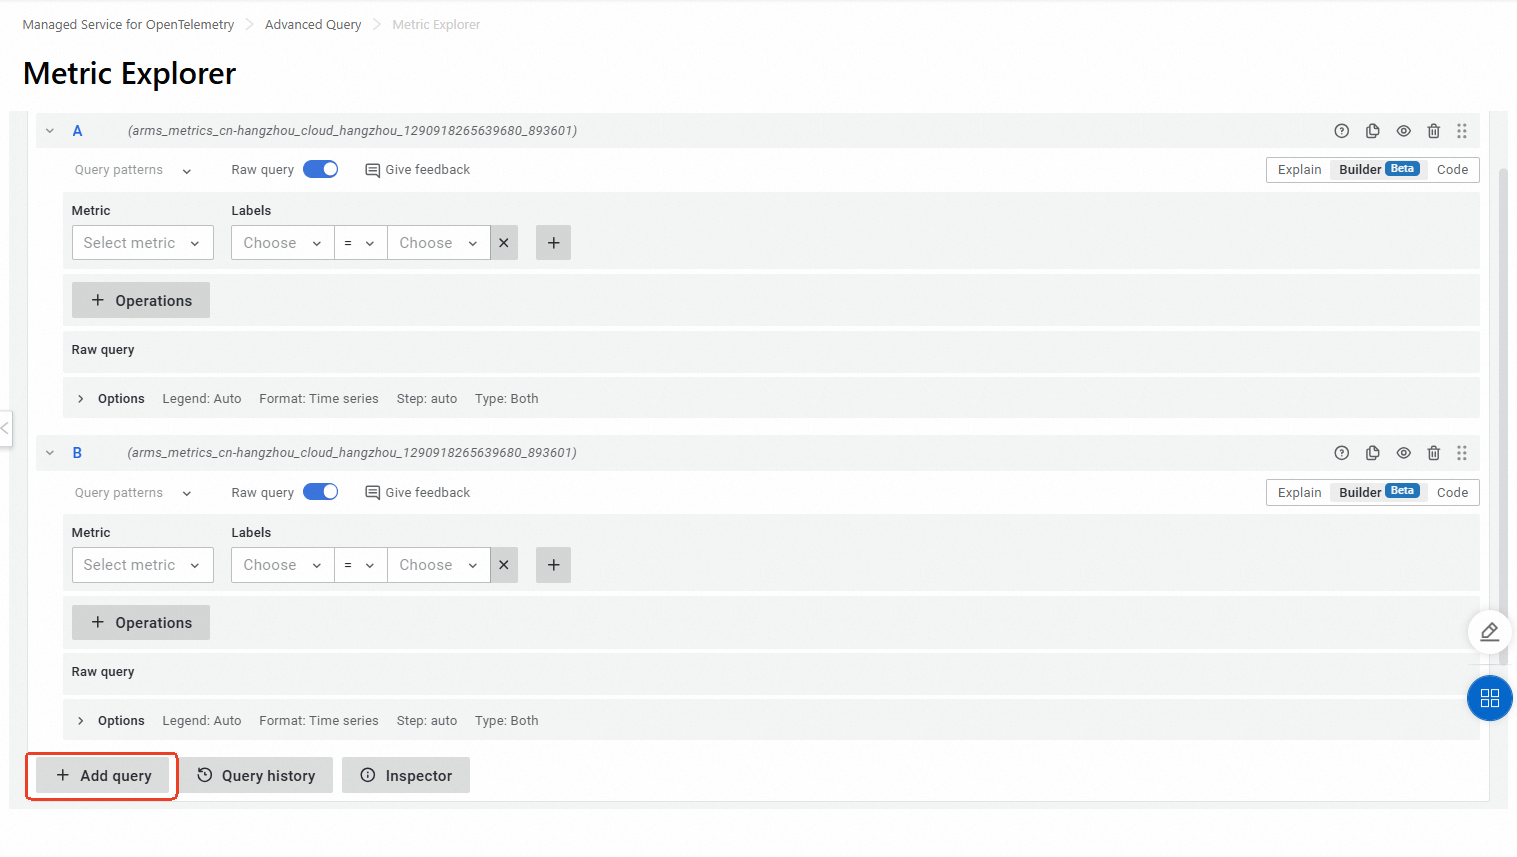
You can use Prometheus Query Language (PromQL) to query metric data.
Metric and label filters: Configure Metric and Labels to filter metrics.
Operations: Click + Operations to add a function. This field can be used to calculate metrics based on functions, range functions, aggregations, and binary operations.
Query: Select a time range, and click Run query to query the traffic of external systems. Then, visualized graphs and lists appear below.
NotePromQL allows complex pattern matching and queries. For syntax and query examples, see official Prometheus documentation.
