Use CloudMonitor to monitor your Open Search applications and get alerted before performance issues affect your users. CloudMonitor collects key metrics — including storage usage, query throughput, compute consumption, and data ingestion rates — and lets you configure alert rules so you can respond to problems early.
Metrics
Open Search exposes metrics across four areas: storage, query performance, compute, and data ingestion.
Storage
| Metric | Description |
|---|---|
| Doc Size | Total storage capacity in use. |
| Doc Size Ratio | Ratio of storage used to purchased storage space. |
| Doc Count | Total number of documents. |
Query performance
| Metric | Description |
|---|---|
| QPS | Number of queries per second. |
| Loss QPS | Number of queries throttled per second. |
| Latency | Duration of a single query on the backend engine, in milliseconds. Network time is excluded. |
| Latency by Gateway | End-to-end duration of a single query request measured at the gateway, in milliseconds. Network time is included. This metric is usually close to Latency but better reflects the latency that clients experience. |
| Status Code by Gateway | Response codes of query requests measured end-to-end at the gateway, grouped by status code. |
Compute
| Metric | Description |
|---|---|
| Compute Resource | Number of logical computing units used for queries per second. |
| Compute Resource Ratio | Ratio of logical computing units used for queries per second to the quota of logical computing units. |
| Compute Resource Quota | Quota of logical computing units allocated to the application. |
| Compute Cost | Number of logical computing units consumed by a single query. |
| Daily Peak Compute Resource | Maximum number of logical computing units that can be used for queries per day. |
Data ingestion
Full import metrics track batch import operations:
| Metric | Description |
|---|---|
| BatchImportThroughput | Bytes read from the data source per second during full import. |
| batch read tps | Documents read from the database per second during full import. |
Real-time import metrics track incremental data updates:
| Metric | Description |
|---|---|
| realtime input throughput | Bytes read from a data source or by calling an API operation per second. |
| realtime trigger latency | Latency in updating real-time data to the secondary table. |
| realtime write latency | Latency in updating real-time data to the primary table. |
| rt read tps | Documents read from a data source or by calling an API operation per second. |
| rt write tps | Documents written to the engine per second during real-time import. Data may be merged or processed by plug-ins. |
| slave trigger tps | Documents updated in the primary table per second due to secondary table updates. For example, if one secondary table entry is updated per second and each maps to three primary table entries, up to three primary table entries may be updated per second. |
| write rate limit qps | Number of times per second that data pushes trigger throttling. |
| Failed Document Updates per Second | Number of documents per second that fail to be written to the engine during real-time import due to invalid data formats, field type mismatches, or business rule validation failures. Use this metric to detect data quality issues or ingestion pipeline problems. |
View metrics in CloudMonitor
-
Log on to the Open Search console. On the Instance Management page, find the application instance and click Details in the Actions column.
-
In the upper-right corner of the Application Details page, click View CloudMonitor Metrics.
-
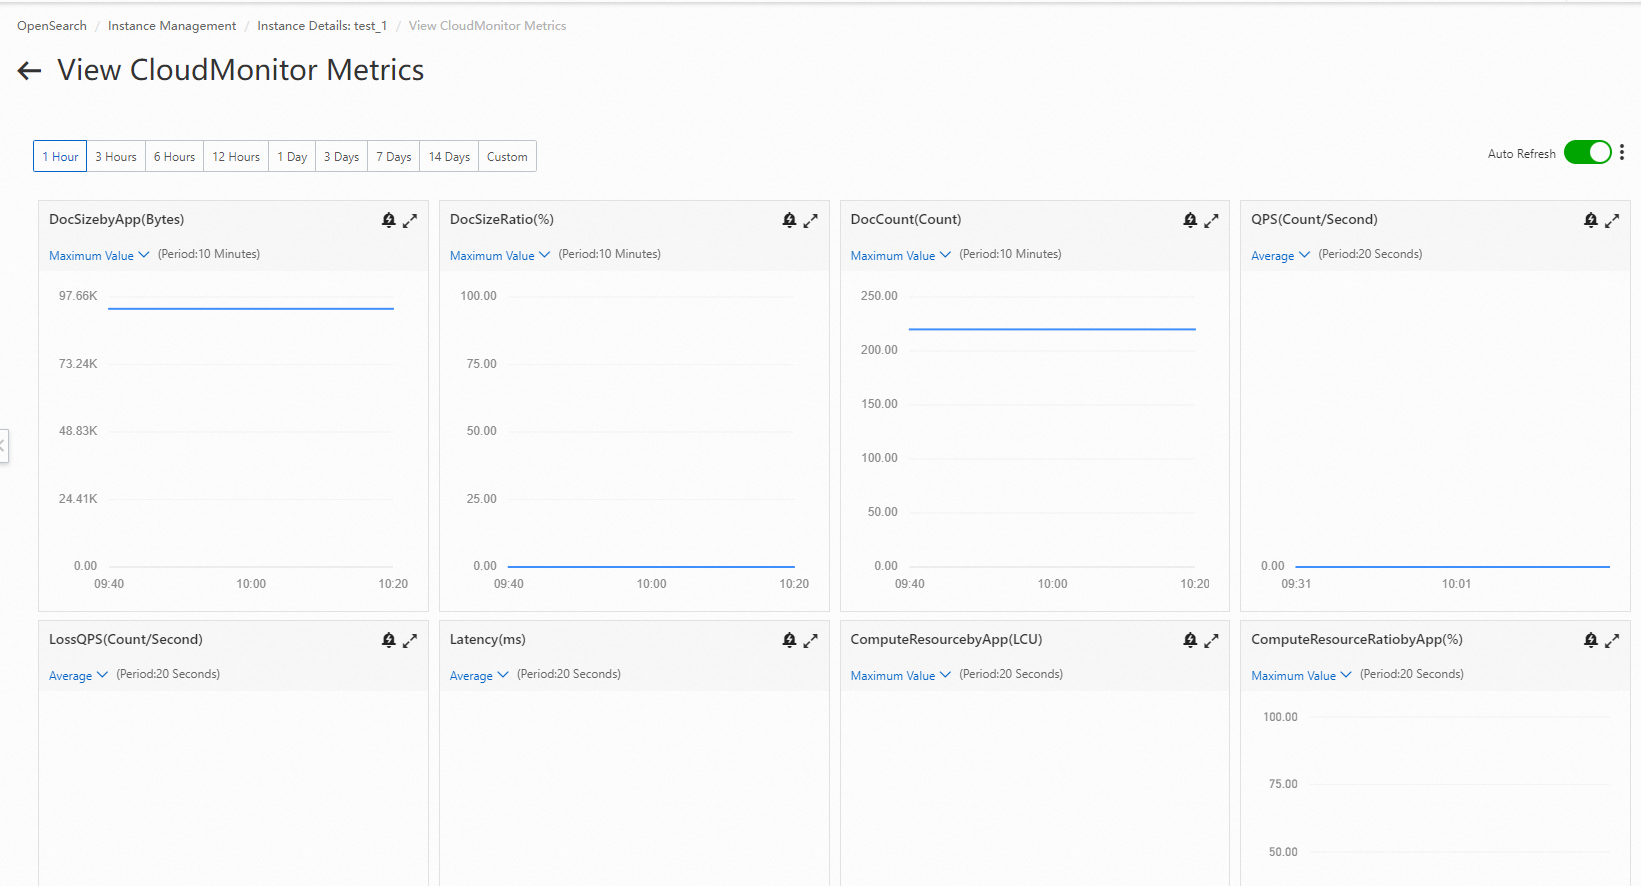
View metrics on the View CloudMonitor Metrics page.
Set up alerting
CloudMonitor provides two alerting options: initiative alerts for quick setup with predefined rules, and custom alert rules for full control over thresholds and notification channels.
Enable initiative alerts
Initiative alerts come pre-configured for four key metrics: capacity usage, computing resource usage, Loss QPS, and real-time processing latency.
-
Log on to the Open Search console with an Alibaba Cloud account. On the Instance Management page, click Initiative Alert.
NoteYou can also go directly to the CloudMonitor console and start from step 3.
-
The Initiative Alert message appears with Status being Disabled. Click Enable Now.
NoteIf the status is already Enabled, skip this step.
-
In the CloudMonitor console, go to Alerts > Initiative Alert. Find Open Search and turn on Initiative Alert. Click the Show icon next to Open Search to view and configure alert rules.
Create custom alert rules
For metrics not covered by initiative alerts, or to fine-tune thresholds and notification contacts, create custom alert rules in CloudMonitor. See Create an alert rule and Create alert contacts or contact groups for step-by-step instructions.
If you need further assistance with CloudMonitor, submit a ticket.