The A/B test report shows how each experiment variant affects search quality and user behavior. OpenSearch tracks five metric categories: core metrics, traffic metrics, behavioral metrics, transaction metrics, and user analysis metrics.
Before you interpret results
Review the following before drawing conclusions from the report:
Data lag: The report shows data for the previous day by default. After you upload behavioral data, the report reflects that data starting the next day.
Date range: Use the date picker to select a specific day or time period. Each metric category includes a 7-day trend chart — click the chart icon next to a metric to open its trend view.
Data dependencies: Metrics that require behavioral data (clicks, favorites, purchases) are only available after you enable the data collection feature and upload the corresponding behavioral data.
View the report
In the left-side navigation pane, choose Report Statistics > A/B Test. Select an application from the Application Name drop-down list, select an experiment group, and then select an experiment. Click a metric category tab and use the date picker to set the time period.
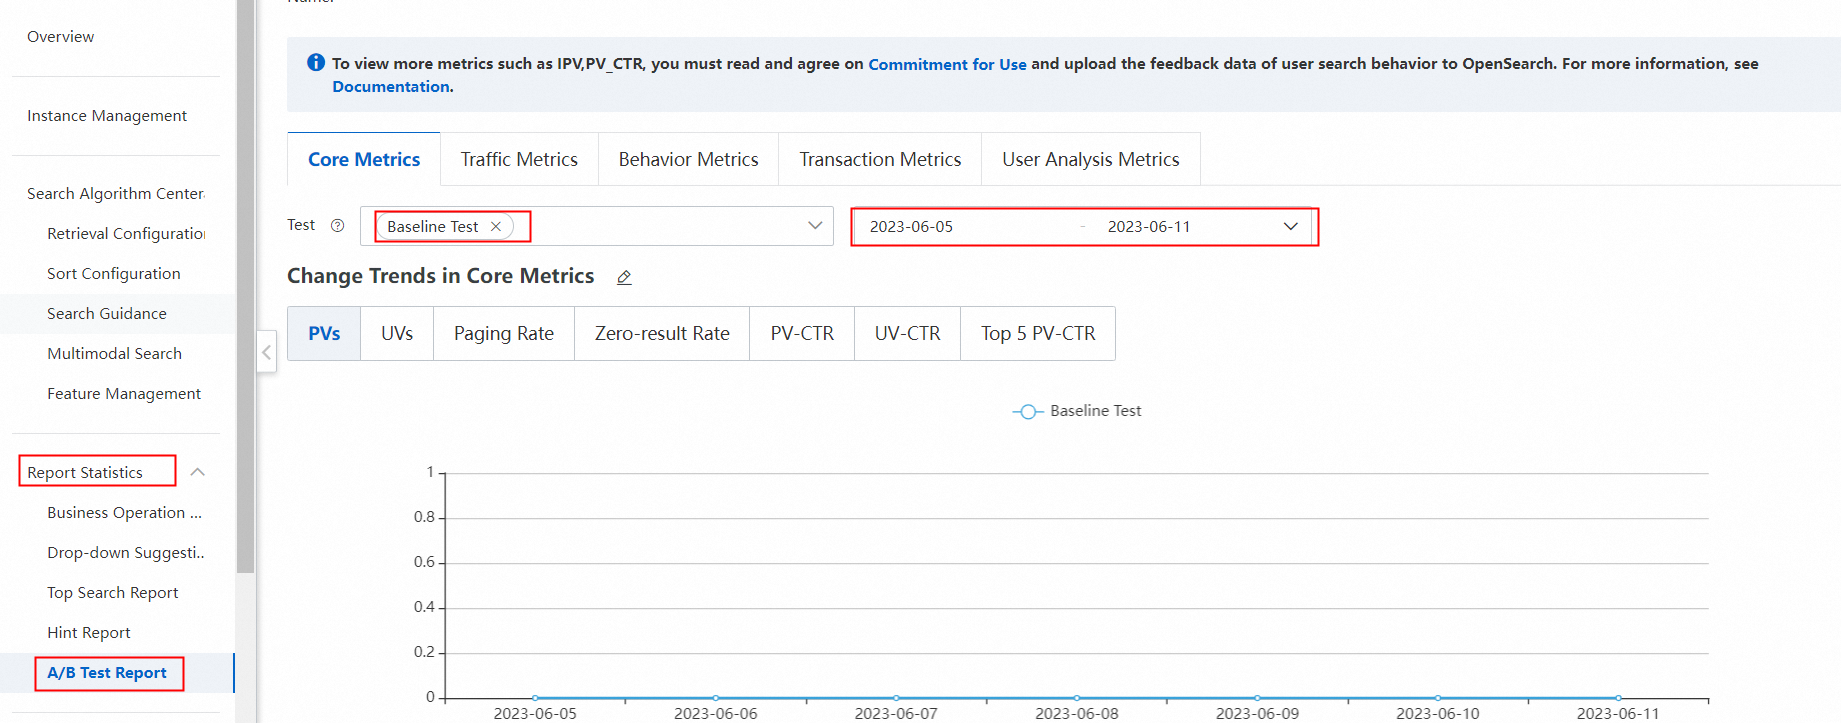
Core metrics
Core metrics give a high-level view of search volume, user engagement, and result quality. Use these metrics to assess the overall health of each experiment variant before diving into behavioral or transaction data.
| Metric | Definition | Formula | Dependency |
|---|---|---|---|
| Search PV | Number of successful search requests, including paging requests. PV stands for page view. | Count of requests that received a success response | — |
| Search UV | Number of users who visited search results pages. UV stands for unique visitor. Each user is counted once regardless of how many searches they performed. | Count of distinct users | user_id in search requests |
| Page turning rate | Ratio of paging requests to all search requests. A high rate may indicate users are not finding what they need on the first page. | Paging requests ÷ Search PV | — |
| No-results rate | Ratio of searches that returned no items to all search requests. A high rate signals retrieval gaps. | Zero-result requests ÷ Search PV | — |
| PV-CTR | Click-through rate (CTR) of search results, measured per search request. | IPV ÷ Search PV | Data collection feature; click behavioral data |
| UV-CTR | CTR measured per user. Complements PV-CTR by smoothing out the effect of users who search many times. | IPV_UV ÷ Search UV | Data collection feature; click behavioral data |
| TOP5 PV-CTR | CTR of the first five items on the first page of search results. Use this to evaluate ranking quality at the top of results. | Clicks on top 5 items ÷ Search PV | Data collection feature; click behavioral data |
| Search PV per capita | Average number of search requests per user. A high value can mean users are engaged but struggling to find results. | Search PV ÷ Search UV | user_id in search requests |
| Next day retention rate | Ratio of users who searched on two consecutive days to users who searched the day before. Indicates user stickiness. | Intersection of Search UV(t-1) and Search UV(t) ÷ Search UV(t-1) | user_id in search requests |
Traffic metrics
Traffic metrics break down search volume, query diversity, and error rates. Use these alongside core metrics to understand search load and identify retrieval problems.
| Metric | Definition | Formula | Dependency |
|---|---|---|---|
| Search PV | Number of successful search requests, including paging requests. | Count of requests that received a success response | — |
| Search UV | Number of users who visited search results pages. | Count of distinct users | user_id in search requests |
| Search PV per capita | Average number of search requests per user. | Search PV ÷ Search UV | user_id in search requests |
| Item impressions | Number of item exposures in search results. If an item reappears on a new page after a paging request, that counts as a new exposure. When behavioral data is available, exposures are counted from the uploaded data; otherwise, the total number of items in results is used. | Count of item exposures (or total result items if no behavioral data) | Data collection feature; item exposure behavioral data (for higher accuracy) |
| Query number | Total queries across all users, deduplicated per user. The same query by the same user is counted once; the same query by two different users is counted twice. If raw_query is present in a request, that value is used; otherwise the default index value is used; if no default index is set, the query is empty. | Sum of per-user deduplicated queries | user_id in search requests; raw_query field (optional) |
| Number of queries per capita | Average number of deduplicated queries per user. | Query number ÷ Search UV | user_id in search requests |
| Number of independent queries | Number of distinct queries across all users. The same query submitted by multiple users counts once. Indicates query diversity. | Count of queries after cross-user deduplication | raw_query field (optional) |
| Page turning rate | Ratio of paging requests to all search requests. | Paging requests ÷ Search PV | — |
| No-results rate | Ratio of searches that returned no items to all search requests. | Zero-result requests ÷ Search PV | — |
| Low-results rate | Ratio of searches that returned five or fewer items to all search requests. | Requests with ≤5 results ÷ Search PV | — |
| Request error times | Number of search requests that received an error response (for example, due to throttling). A spike may indicate you need to scale out. | Count of requests that received an error | — |
| Request error rate | Ratio of failed requests to all requests. | Request error times ÷ (Search PV + Request error times) | — |
Behavioral metrics
Behavioral metrics track how users interact with search results: clicks, favorites, cart additions, likes, and comments. All behavioral metrics require the data collection feature to be enabled and the corresponding behavioral data to be uploaded.
| Metric | Definition | Formula | Dependency |
|---|---|---|---|
| IPV | Number of clicks on items in search results. | Count of item clicks | Data collection feature; click behavioral data |
| IPV_UV | Number of users who clicked at least one item in search results. Each user is counted once. | Count of distinct users who clicked | Data collection feature; click behavioral data; user_id |
| IPV per capita | Average number of item clicks per user. | IPV ÷ Search UV | Data collection feature; click behavioral data; user_id |
| PV-CTR | CTR of search results, measured per search request. | IPV ÷ Search PV | Data collection feature; click behavioral data |
| UV-CTR | CTR measured per user. | IPV_UV ÷ Search UV | Data collection feature; click behavioral data |
| Item-CTR | CTR at the item level — how often an exposed item gets clicked. | IPV ÷ Item impressions | Data collection feature; click behavioral data |
| Percentage of clicked PV | Ratio of search requests where users clicked at least one result. | Clicked search requests ÷ Search PV | Data collection feature; click behavioral data |
| TOP3 PV-CTR | CTR of the first three items on the first page. | Clicks on top 3 items ÷ Search PV | Data collection feature; click behavioral data |
| TOP5 PV-CTR | CTR of the first five items on the first page. | Clicks on top 5 items ÷ Search PV | Data collection feature; click behavioral data |
| TOP10 PV-CTR | CTR of the first ten items on the first page. | Clicks on top 10 items ÷ Search PV | Data collection feature; click behavioral data |
| Number of collections | Number of times users added items from search results to favorites. | Count of favorites additions | Data collection feature; favorites behavioral data; bhv_type = collect |
| Favorite conversion rate | Ratio of favorites additions to all search requests. | Number of collections ÷ Search PV | Data collection feature; favorites behavioral data; bhv_type = collect |
| Additional purchases | Number of times users added items from search results to the shopping cart (or bookshelf or playlist). | Count of cart additions | Data collection feature; cart behavioral data; bhv_type = cart |
| Add-on conversion rate | Ratio of cart additions to all search requests. | Additional purchases ÷ Search PV | Data collection feature; cart behavioral data; bhv_type = cart |
| Likes | Number of times users liked items in search results. | Count of likes | Data collection feature; like behavioral data; bhv_type = like |
| Like conversion rate | Ratio of likes to all search requests. | Likes ÷ Search PV | Data collection feature; like behavioral data; bhv_type = like |
| Number of comments | Number of times users posted comments on items in search results. | Count of comments | Data collection feature; comment behavioral data; bhv_type = comment |
| Comment conversion rate | Ratio of comments to all search requests. | Number of comments ÷ Search PV | Data collection feature; comment behavioral data; bhv_type = comment |
Transaction metrics
Transaction metrics measure how effectively search results drive purchases. All transaction metrics require bhv_type = buy in the uploaded behavioral data.
| Metric | Definition | Formula | Dependency |
|---|---|---|---|
| Search guide GMV | Gross merchandise volume (GMV) of purchases made from search results. | Sum of transaction amounts | Data collection feature; purchase behavioral data; bhv_type = buy |
| Search guide deal UV | Number of users who made a purchase from search results. Each user is counted once. | Count of distinct purchasing users | Data collection feature; purchase behavioral data; bhv_type = buy; user_id |
| Search guide customer unit price | Average transaction amount per purchasing user. | Search guide GMV ÷ Search guide deal UV | Data collection feature; purchase behavioral data; bhv_type = buy |
| Order conversion rate | Ratio of users who made a purchase to all users who visited search results pages. | Search guide deal UV ÷ Search UV | Data collection feature; purchase behavioral data; bhv_type = buy |
| Click-through rate | Ratio of users who made a purchase after clicking a search result to all users who clicked search results. | Search guide deal UV ÷ IPV_UV | Data collection feature; purchase behavioral data; bhv_type = buy |
User analysis metrics
User analysis metrics give you a view of long-term engagement and user drop-off.
| Metric | Definition | Formula | Dependency |
|---|---|---|---|
| Next day retention rate | Ratio of users who searched on two consecutive days to users who searched the day before. | Intersection of Search UV(t-1) and Search UV(t) ÷ Search UV(t-1) | user_id in search requests |
| Lost user rate | Ratio of users who visited search results pages but never clicked any item. A high rate suggests poor retrieval quality or irrelevant rankings. | (Search UV − IPV_UV) ÷ Search UV | Data collection feature; click behavioral data; user_id |