OpenSearch integrates with CloudMonitor to give you real-time visibility into your application's resource usage. Monitor query performance, storage consumption, and data ingestion throughput — and configure alert rules to get notified before issues affect your users.
Metrics
CloudMonitor tracks the following metrics for each OpenSearch application.
Query performance
| Metric | Description |
|---|---|
| QPSbyApp | The number of queries per second. |
| LossQPSbyApp | The number of queries that are throttled per second. |
| LatencybyApp | The duration of a single query, in milliseconds. |
| ComputeResourcebyApp | The number of logical computing units used for queries per second. |
| ComputeResourceRatiobyApp | The ratio of the logical computing units that are used for queries per second to the quota of logical computing units. |
| ComputeCostbyApp | The logical computing units that are consumed in a single query. |
| DailyPeakComputeResourcebyApp | The maximum number of logical computing units that can be used for queries per day. |
Storage
| Metric | Description |
|---|---|
| DocSizebyApp | The total storage capacity that is used. |
| DocSizeRatiobyApp | The ratio of the storage usage to the document quota. |
| DocCountbyApp | The total number of documents. |
Data ingestion
| Metric | Description |
|---|---|
| APP Batch Import Throughput | The number of bytes that an application reads from a data source per second when full data is imported. |
| APP Batch Read TPS | The number of documents that an application reads from a database per second when full data is imported. |
| App Batch Write TPS | The number of documents that an application writes to an engine per second when full data is imported and processed. In data processing, data may be merged or processed by using plug-ins. |
| APP Realtime Input Throughput | The number of bytes that an application reads from a data source or by calling an API operation per second. |
| APP Realtime Trigger Latency | The latency in updating the real-time data to secondary tables. |
| APP Realtime Write Latency | The latency in updating the real-time data to the primary table. |
| APP RT Read TPS | The number of documents that an application reads from a data source or by calling an API operation per second. |
| APP RT Write TPS | The number of documents that an application writes to an engine per second when real-time data is imported and processed. In data processing, data may be merged or processed by using plug-ins. |
| APP Slave Trigger TPS | The number of documents updated in the primary table per second due to the update of secondary tables. For example, one entry in a secondary table is updated per second, and the number of entries in the primary table is three times that of entries in the secondary table. In this case, three entries in the primary table may be updated per second. |
| Application Realtime Push Throttling QPS | The number of times that an application pushes data per second to trigger throttling. |
View metrics in CloudMonitor
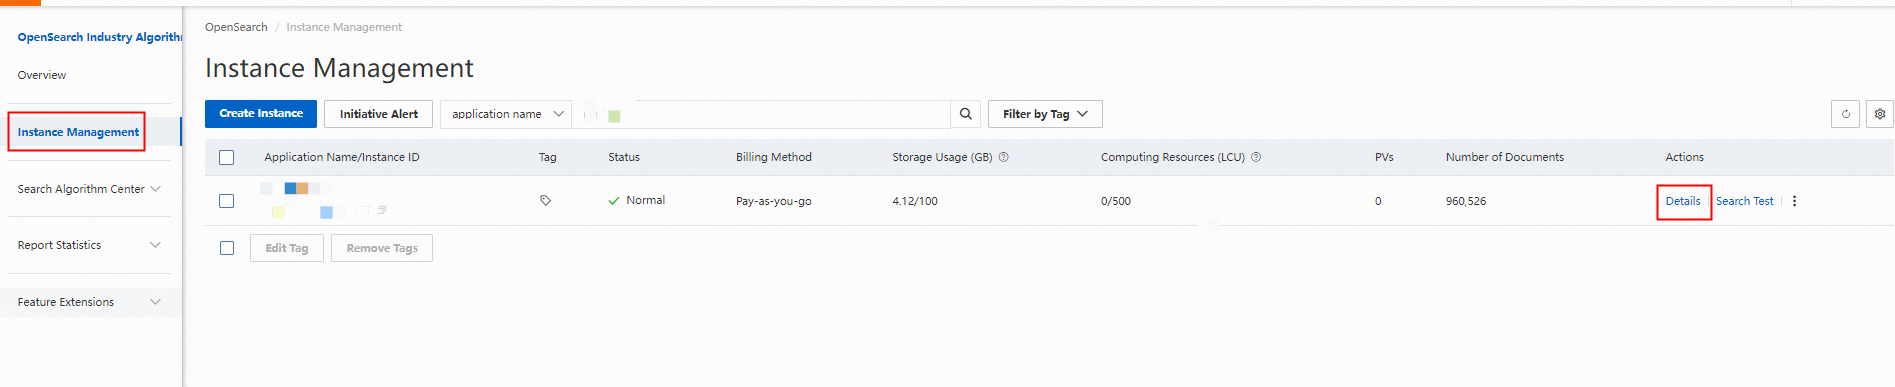
Log on to the OpenSearch console. In the upper-left corner, hover over the OpenSearch edition selector and choose OpenSearch High-performance Search Edition. On the Instance Management page, find your application and click Details in the Actions column.
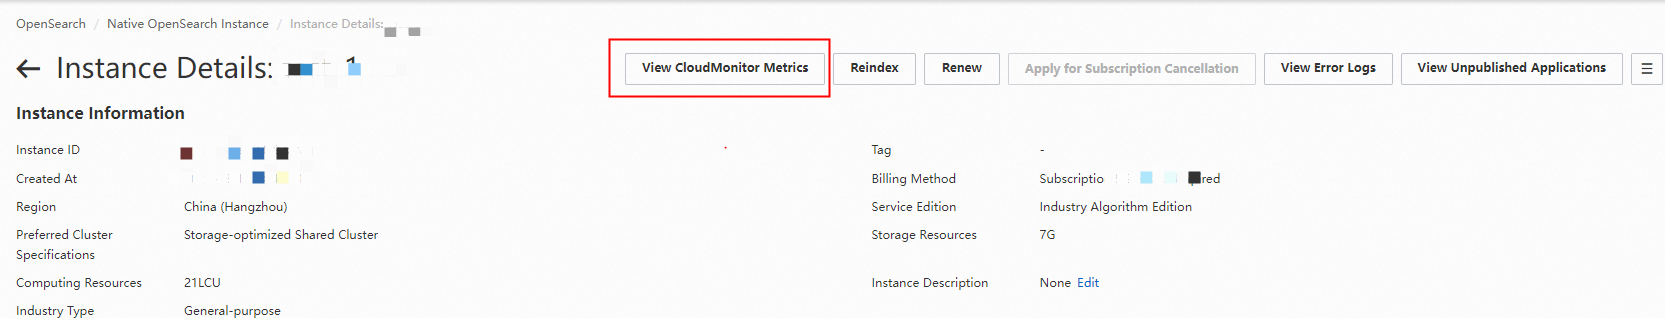
In the upper-right corner of the Application Details page, click View CloudMonitor Metrics.
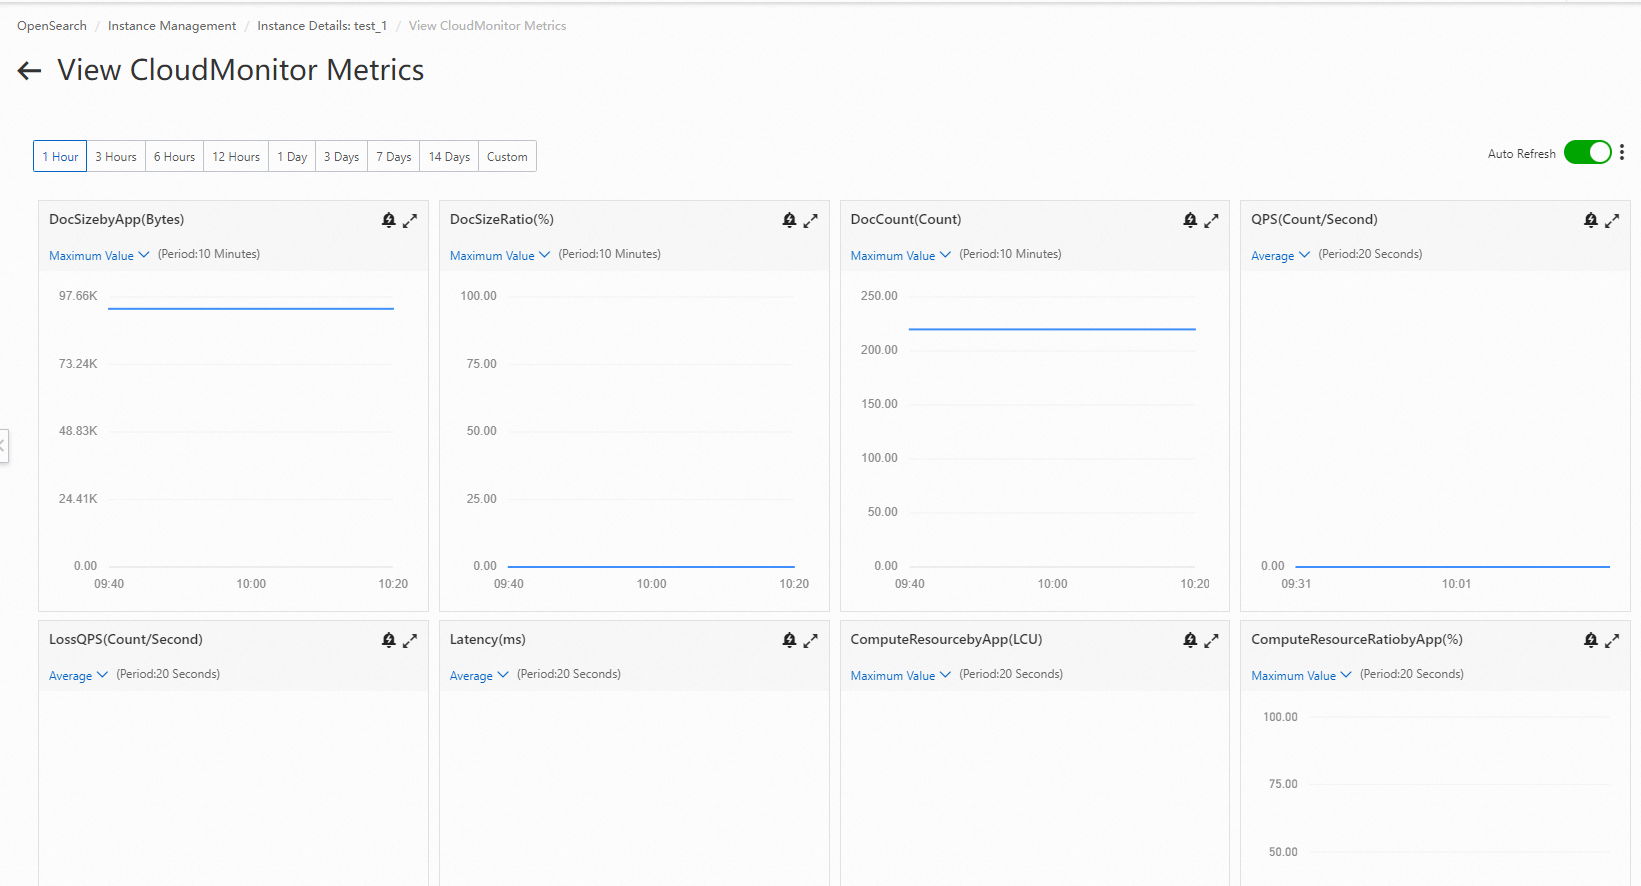
Review metric details on the View CloudMonitor Metrics page.
Enable initiative alert
The initiative alert feature monitors four metrics out of the box: DocSizeRatiobyApp, ComputeResourceRatiobyApp, LossQPSbyApp, and APP Realtime Write Latency.
To enable initiative alert:
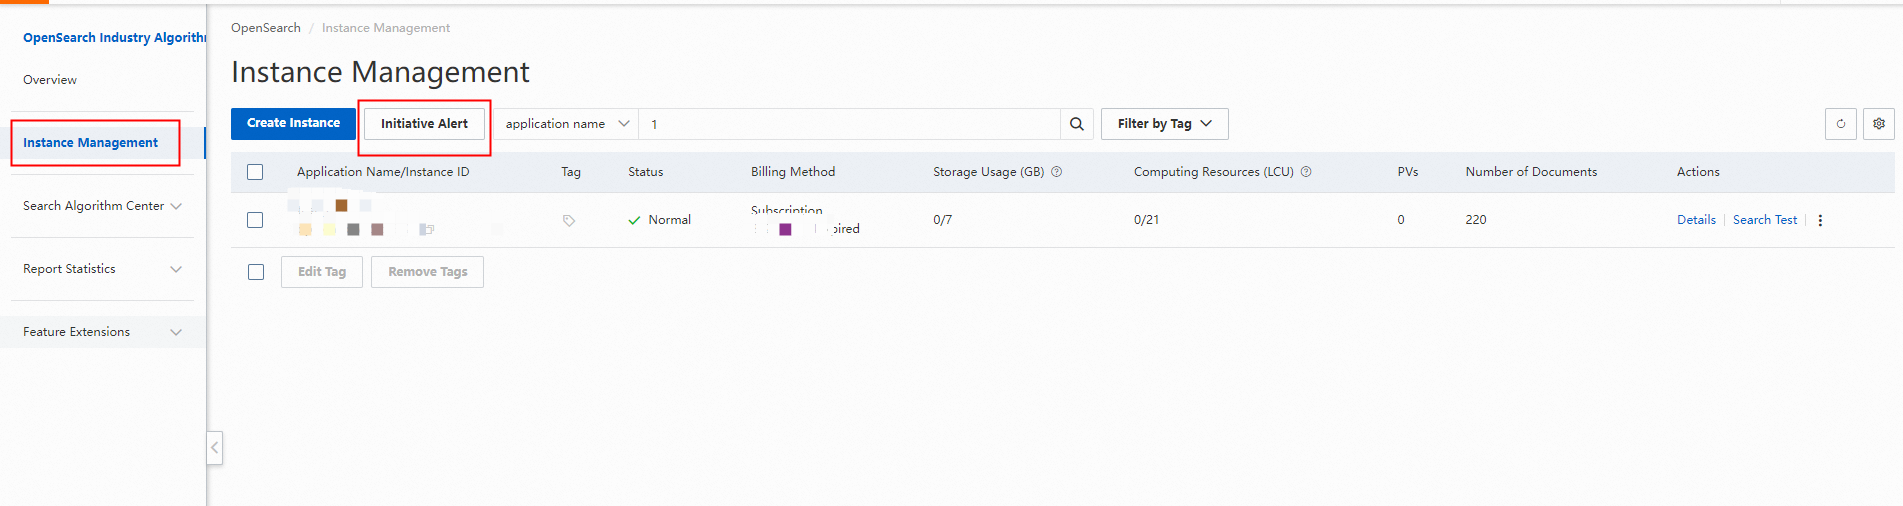
Log on to the OpenSearch console using your Alibaba Cloud account. On the Instance Management page, click Initiative Alert.
Alternatively, log on to the CloudMonitor console and skip to step 3.
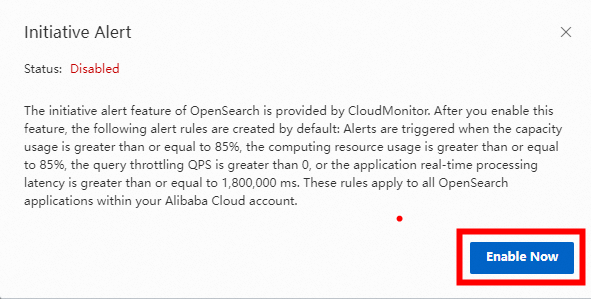
In the Initiative Alert dialog, click Enable Now if the feature is currently disabled.
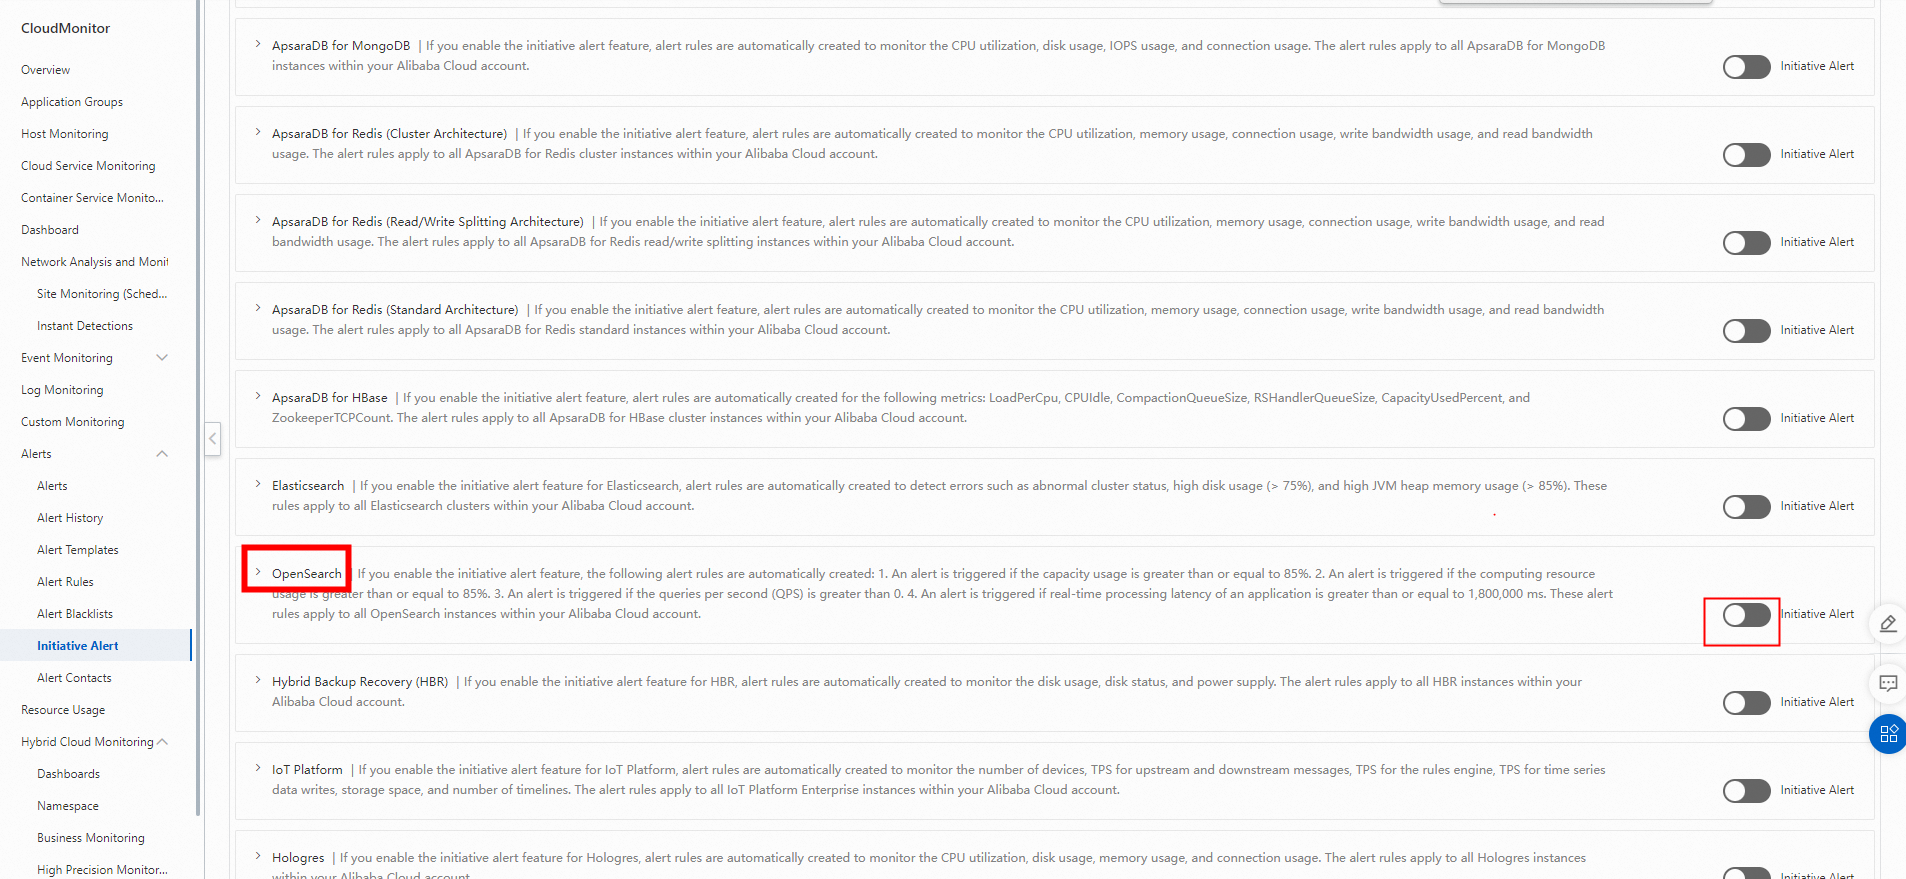
In the CloudMonitor console, go to Alerts > Initiative Alert. Find OpenSearch and turn on Initiative Alert. Click the Show icon next to OpenSearch to view and configure the individual alert rules.
Create a custom alert rule
To monitor metrics beyond the four defaults, create custom alert rules in CloudMonitor and configure who gets notified. For instructions, see Create an alert rule. To set up notification recipients, see Create an alert contact or alert contact group.
Note: If the above topics don't resolve your CloudMonitor issue, submit a ticket.