Background
During daily business development, slow queries are common in OpenSearch because of many factors such as inappropriate operations, a large number of filter conditions, and sharply increased queries per second (QPS) during a period of time. The slow query optimization feature provided by OpenSearch allows you to view the details of slow queries that consume heavy logical computing unit (LCU) resources within a specified period of time. The feature also provides the corresponding optimization suggestions to help you reduce costs.
Benefits
Free to use: You can enable and use the slow query optimization feature for free.
Use on demand: You can query the records of slow queries in the last month and obtain the corresponding optimization suggestions.
Comprehensive metrics: You can analyze the causes of slow queries based on metrics such as average LCU consumption, peak-hour LCU consumption, total LCU consumption, and percentage of slow queries to total queries. You can also sort slow queries based on the preceding metrics in descending order.
Usage notes
The slow query optimization feature allows you to analyze the data that was generated on the previous day. Analyzed sample results can be retained for up to 30 days.
Procedure
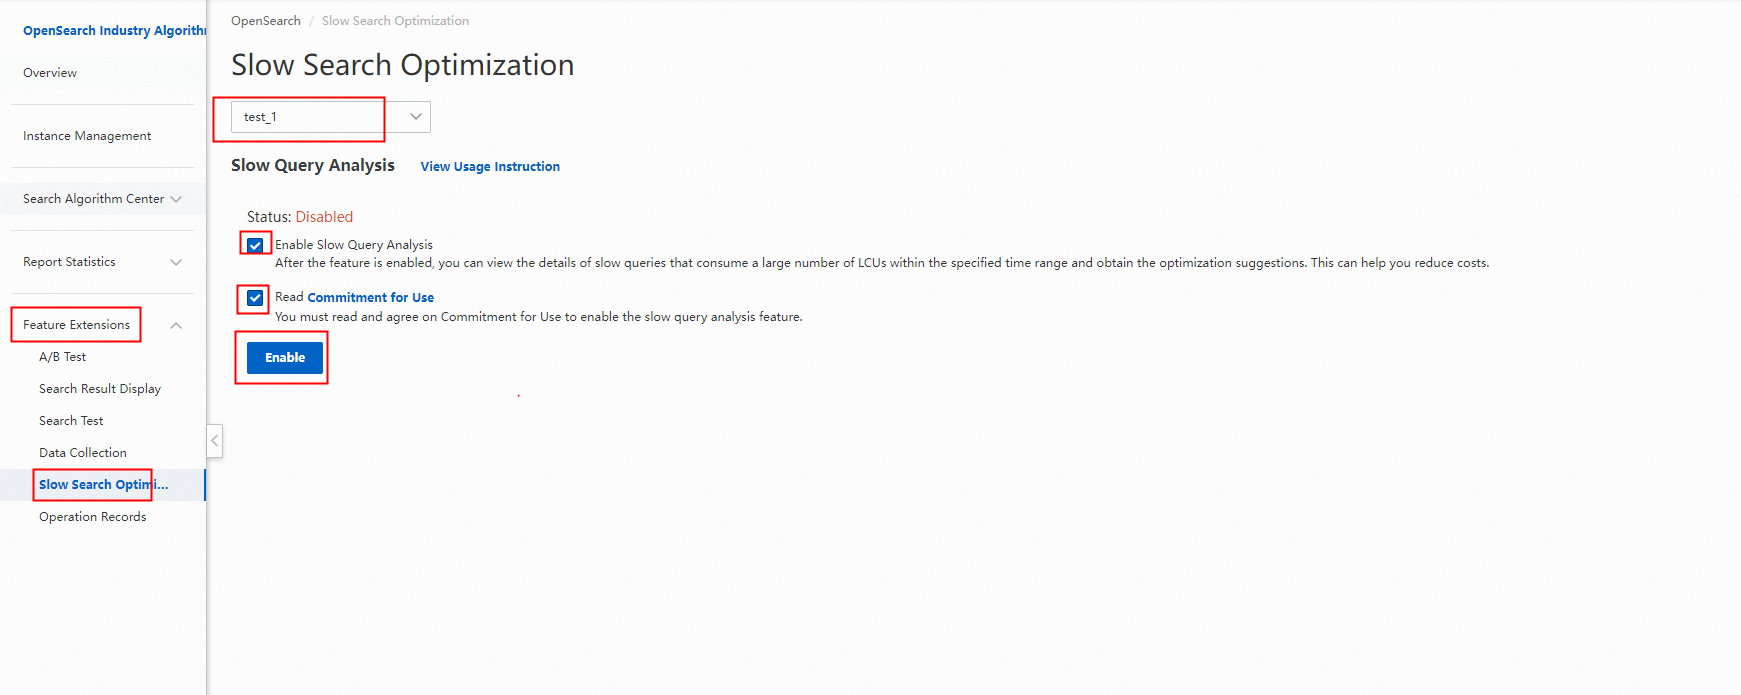
1. Log on to the OpenSearch console. In the left-side navigation pane, click OpenSearch Industry Algorithm Edition and select OpenSearch High-performance Search Edition, and then choose Feature Extensions > Slow Search Optimization.

On the Slow Search Optimization page, select an application for which you want to enable the slow query optimization feature, select Enable Slow Query Analysis and Read Commitment for Use, and then click Enable to enable the slow query optimization feature.
2. After the slow query optimization feature is enabled, click Analyze to analyze slow query data. Wait until the analysis is completed.
3. View the analysis results of slow query data. You can select different time ranges to view the analysis results on a specific day. You can also sort the analysis results by different dimensions.
  The following figure shows an analysis report.