The Overview page displays dashboards with key security metrics and threat trends, helping you monitor your network's risk status, track security service responses, and assess the business value that Managed Security Service (MSS) delivers.
-
Log on to the Managed Security Service console. By default, the Overview page is displayed.
-
(Optional) In the upper-left corner of the Overview page, you can filter the data by time range and alert source.
-
By default, statistics for the last 30 days are displayed. You can filter the data by Last 7 Days, Last 6 Months, Last 1 Year, or a custom time range.
-
If you have activated security products such as Security Center, WAF, Cloud Firewall, and Anti-DDoS, MSS integrates threat data from these products. Select an alert source from the drop-down list to filter alerts.
-
The Auto Refresh feature is enabled by default and updates page data every 5 minutes. You can toggle this feature in the upper-right corner of the Overview page.
-
-
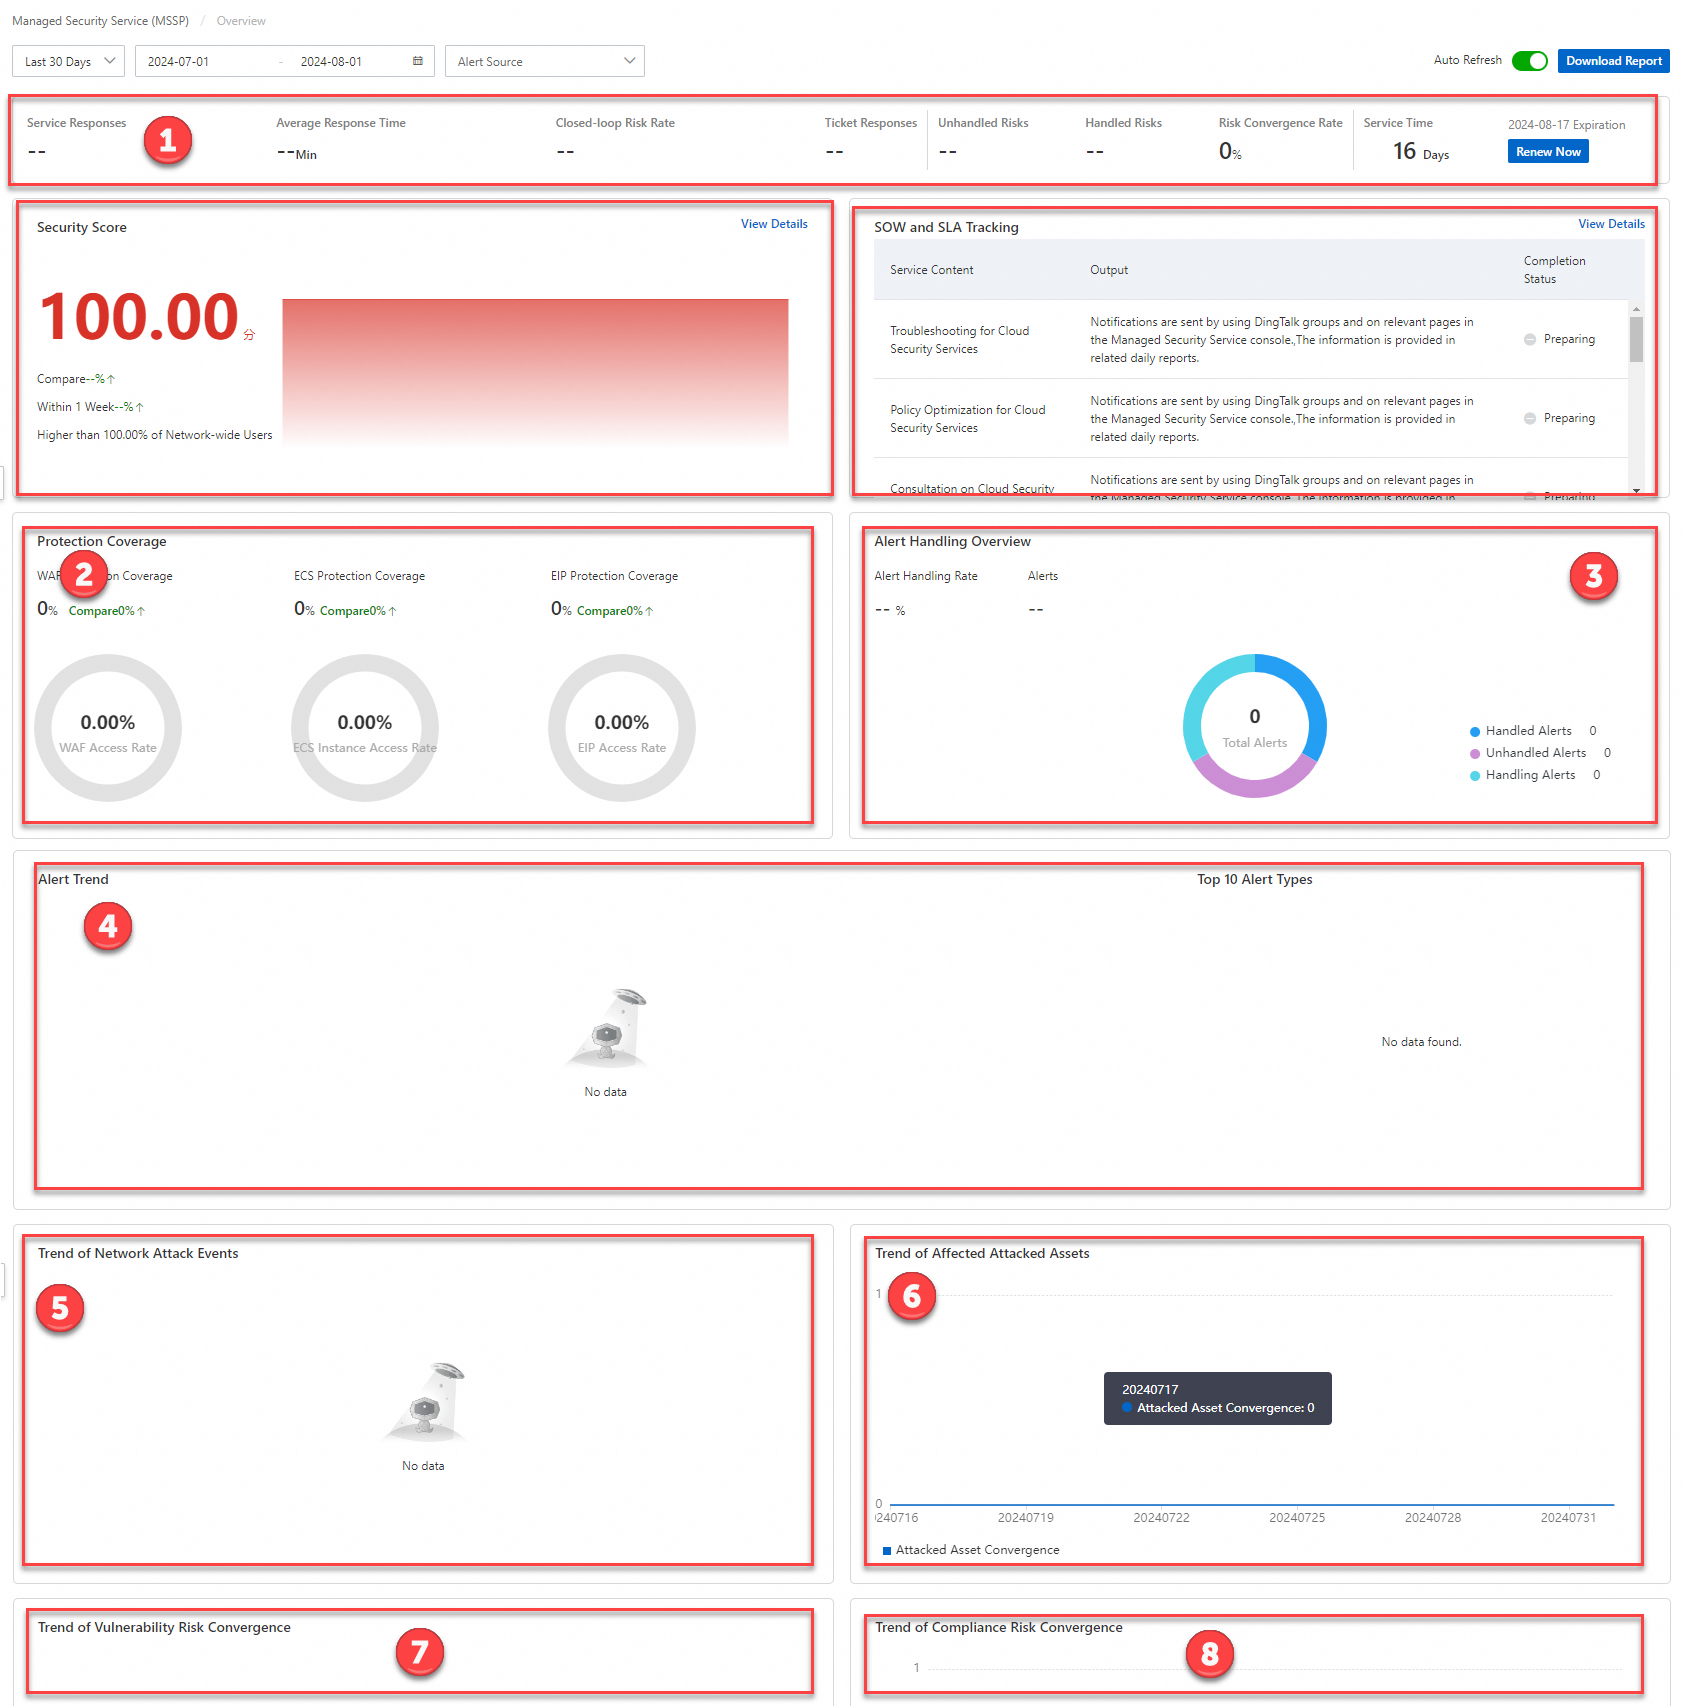
On the Overview page, you can view the service statistics.
The Overview page includes modules for service statistics, protection coverage, and alert handling. The following table describes each module.
Module
Description
Security service data statistics
(Marked as ① in the figure)
Displays MSS statistics on security service response status.
-
Service Responses: The total number of service ticket responses within the selected time range and the year-over-year growth rate.
-
Average Response Time: The average time taken to resolve each alert, from generation to resolution, within the selected time range.
-
Closed-loop Risk Rate: The percentage of alerts that were closed within the selected time range. Issue Closure Rate = (Number of closed alerts ÷ Total number of alerts) × 100%.
-
Ticket Responses: The total number of alerts that are generated within the selected time range.
-
Unhandled Risks: The total number of unremediated system and application vulnerabilities within the selected time range.
-
Handled Risks: The total number of vulnerabilities fixed within the selected time range, including system and application vulnerabilities.
-
Risk Convergence Rate: The percentage of vulnerabilities fixed within the selected time range. This value is calculated using the following formula: (Number of fixed vulnerabilities ÷ Total number of vulnerabilities) × 100%.
-
Managed Security Service: Displays the service expiration date and the number of days remaining. If the service is about to expire, click Renew Now and follow the prompts to complete the renewal.
Protection Coverage (Indicated by ② in the figure)
Shows the protection status of cloud assets in your Alibaba Cloud account, helping you identify unprotected assets.
-
WAF Protection Coverage: The coverage of cloud assets protected by WAF and its year-over-year growth rate.
WAF Protection Coverage = (Number of assets protected by WAF ÷ Total number of assets that can be protected by WAF in the current Alibaba Cloud account) × 100%.
-
ECS Protection Coverage: The percentage of ECS assets protected by Security Center and its year-over-year growth rate.
ECS Protection Coverage = (Number of ECS assets protected by Security Center ÷ Total number of ECS assets in the current Alibaba Cloud account) × 100%.
-
EIP Protection Coverage: The percentage of EIPs protected by Cloud Firewall and the year-over-year growth rate of the coverage.
EIP Protection Coverage = (Number of EIPs protected by Cloud Firewall ÷ Total number of EIPs in the current Alibaba Cloud account) × 100%.
Alert Handling Overview (Indicated by ③ in the figure)
Shows the percentage of alerts in each state (Handled, Unhandled, and In Progress) and the year-over-year growth rate of total alerts.
Alert Handling Rate = Number of handled alerts ÷ (Number of handled alerts + Number of unhandled alerts + Number of in-progress alerts) × 100%.
Alert Trend (Indicated by ④ in the figure)
The line chart on the left shows the trend in the total number of generated alerts and the number of converged alerts.
The list on the right shows the top 10 alert types with the largest number of handled alerts.
Trend of Network Attack Events: This section is marked as ⑤ in the figure.
Shows the alert volume trend by source, including Anti-DDoS, WAF, and Cloud Firewall.
Trend of Affected Attacked Assets (⑥ in the figure)
Displays the trend in the number of ECS assets that triggered alerts.
Trend of Vulnerability Risk Convergence
(Item ⑦ in the figure)
Displays the trends in the number of generated vulnerabilities and the number of fixed vulnerabilities. Vulnerability types include system vulnerabilities and application vulnerabilities.
Trend of Compliance Risk Convergence (⑧ in the figure)
Displays the trends in the number of generated baseline risks and the number of fixed baseline risks.
-