ApsaraDB for MongoDB updates the advanced monitoring feature. If you use Grafana to monitor your ApsaraDB for MongoDB instance, view the region where the instance is located and select the latest dashboard URL corresponding to the region. This can reduce the latency and improve the stability. For more information about the mapping between regions and the latest dashboard URL, see the "Content" section of this topic.
Effective date
October 28, 2024
Scope
Instances are standalone, replica set, or sharded cluster instances.
Content
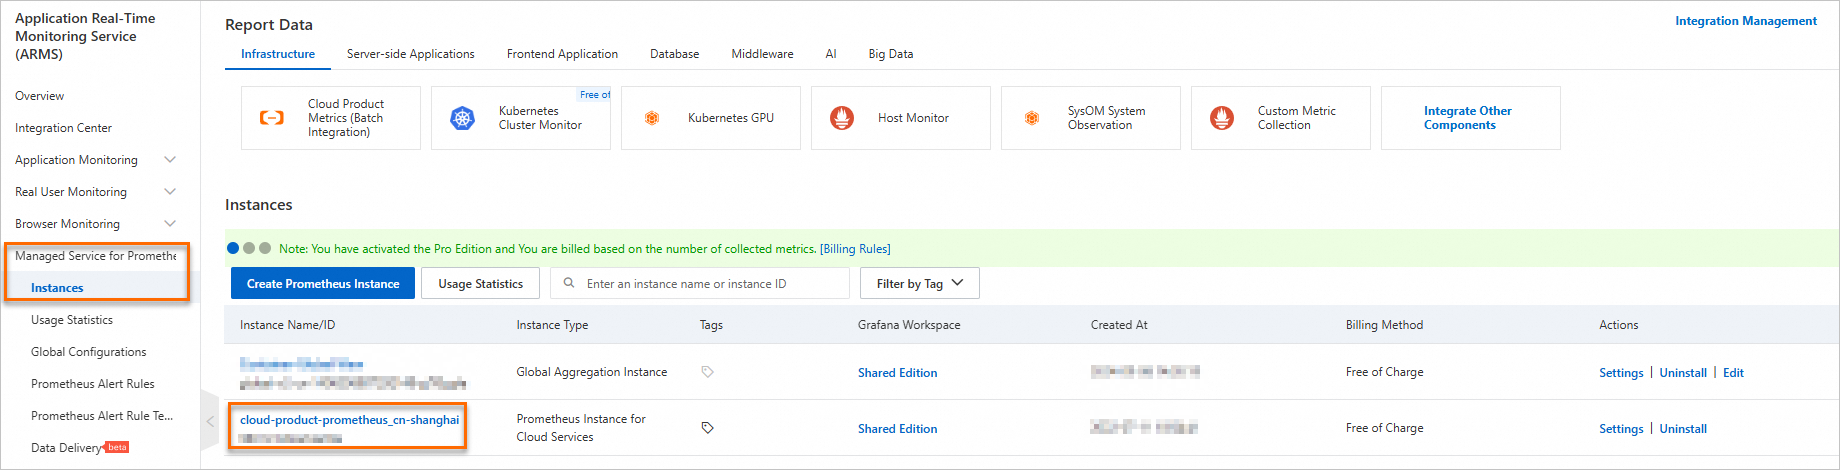
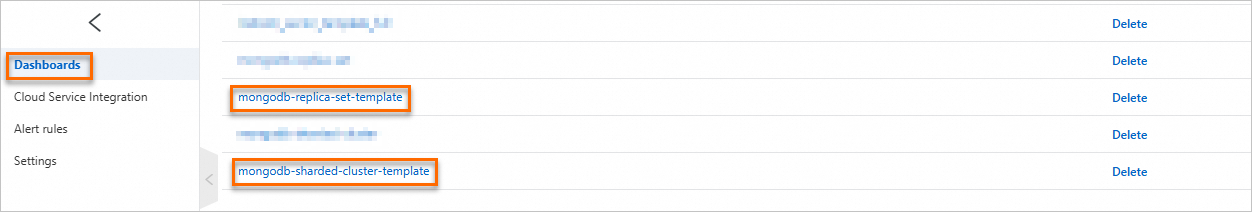
Assume that you have used two MongoDB dashboards named mongodb-replica-set-template and mongodb-sharded-cluster-template in the instance whose ID is cloud-product-prometheus_cn-shanghai in the Application Real-Time Monitoring Service (ARMS), as shown in the following figure.
Select the latest dashboard URL corresponding to the region where your ApsaraDB for MongoDB instance is located.
Region | Dashboard URL |
| Original ApsaraDB for MongoDB dashboard URL. |
Other regions. You can call the DescribeRegions operation to query the regions. | You can call the ListDashboards operation to query the latest dashboard URL. To query the URL, configure the following parameters:
|