Model Evaluation is a model quality evaluation tool provided by the Alibaba Cloud Model Studio platform. It supports quantitative evaluation of large language model performance through custom evaluation dimensions, helping you complete model selection, tuning verification, and capability comparison.
What is Model Evaluation
Model Evaluation is a model quality verification tool provided by the Alibaba Cloud Model Studio platform. Through custom evaluation dimensions and scoring methods, you can quantitatively evaluate the performance of large language models in specific business scenarios and obtain comparable evaluation results.
Use Cases
Model Evaluation applies to the following scenarios:
- Model selection: compare scores across multiple candidate models to choose the one that best fits your business needs.
- Tuning verification: after Prompt tuning or fine-tuning a model, use evaluation to verify whether performance has improved.
- Quantitative evaluation: convert model output quality into measurable score metrics to replace subjective judgment.
- Continuous monitoring: run evaluation tasks periodically to track the trend of model capabilities across version iterations.
Scoring Methods
Model Evaluation supports 5 scoring methods, covering both automatic scoring and manual scoring:
- LLM Numerical Scoring: the judge model gives a numerical score (such as 0-5 points) according to the Scorer Prompt, suitable for scenarios that require fine-grained quantification.
- LLM Classification Scoring: the judge model assigns the output to predefined categories (such as Pass/Fail) according to the Scorer Prompt, suitable for binary or multi-label judgments.
- String Matching: performs exact comparison (equal, contains, starts with, ends with, etc.) between the model output and the reference answer, suitable for scenarios with a single standard answer.
- Text Similarity: uses algorithms (ROUGE-L, BLEU, Cosine, Fuzzy, Accuracy) to compute the similarity between the model output and the reference answer, suitable for text generation quality assessment.
- Manual Classification Scoring: human annotators classify and judge the model output, suitable for subjective evaluation scenarios that automatic scoring cannot cover.
Models that can be evaluated include Qwen series commercial models, Qwen open-source models, Tongyi Farui, and others. The available models are subject to the Model to Be Evaluated drop-down list in the console.
An overview comparison of the 5 scoring methods is as follows:
Scoring Method | Scoring Source | Applicable Scenarios | Cost |
|---|---|---|---|
LLM Numerical Scoring | Judge model | Semantic understanding, open-ended evaluation | Medium |
LLM Classification Scoring | Judge model | Binary judgment (safety/correctness) | Medium |
String Matching | Rule | Scenarios with a single standard answer | Very low |
Text Similarity | Algorithm | Translation and summary quality assessment | Low |
Manual Classification Scoring | Human annotator | Creativity evaluation, subjective judgment | High |
Prerequisites and Limits
The full evaluation workflow is: Create an Evaluation Dimension → Prepare Evaluation Data → Create an Evaluation Task → View Evaluation Results.
Before using Model Evaluation, confirm the following conditions:
- You have registered an Alibaba Cloud account and completed real-name verification.
- You have activated the Alibaba Cloud Model Studio service. Activation URL: https://modelstudio.console.alibabacloud.com.
- If you operate as a RAM user, the primary account must grant the corresponding permissions.
Model Evaluation is only accessible through the console; no API or SDK invocation is provided.
Important
Qwen3 series models do not support evaluation in Thinking Mode for now. To evaluate a Qwen3 model, disable Thinking Mode before creating the evaluation task.
Prepare Evaluation Data
Evaluation data is the input to an evaluation task and determines on which questions the model is evaluated. Alibaba Cloud Model Studio supports two data sources: evaluation datasets (test questions prepared in advance) and inference result sets (inference results already generated by the model).
Data Format Description
An evaluation dataset contains the following fields:
- Prompt (required): the input question sent to the model to be evaluated. Every entry must include this field.
- Completion (optional): the reference answer, used by scoring methods (such as String Matching and Text Similarity) for comparison with the model output.
- Output (inference result set only): the output content already generated by the model. When using an inference result set, the evaluation task scores the Output directly and does not call the model to be evaluated again.
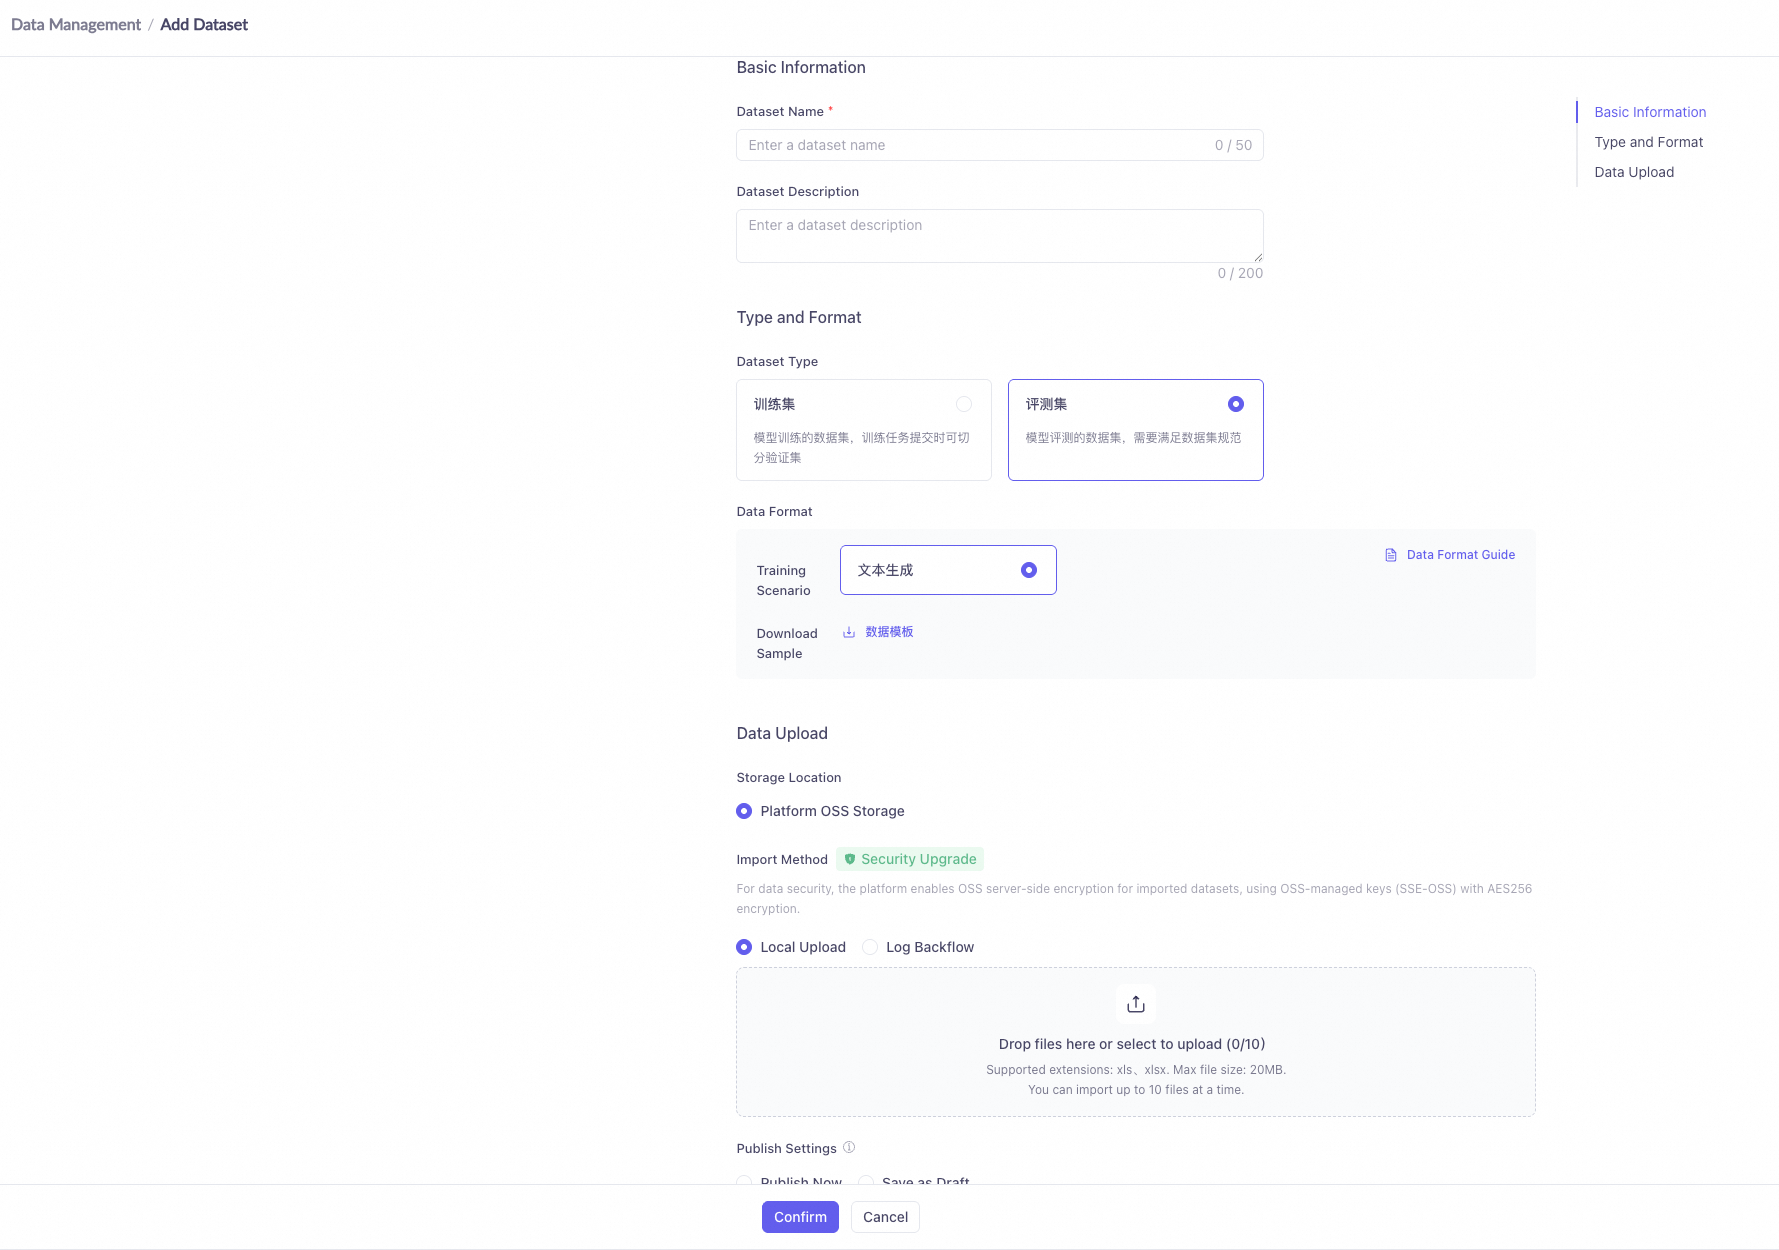
The dataset type must be Evaluation Set. A dataset of the training set type cannot be used in evaluation tasks. When creating a dataset, select Dataset Type and choose Evaluation Set.
WarningWhen creating a dataset, you must select the evaluation set as the dataset type. If you mistakenly select the training set, the dataset cannot be used in evaluation tasks. The dataset type cannot be changed after creation and a new dataset must be created.
The field descriptions of evaluation data are as follows:
Field | Required | Description | Applicable Scenarios |
|---|---|---|---|
Prompt | Required | Input question sent to the model to be evaluated | All evaluation methods |
Completion | Optional | Reference answer, used for comparison with the model output | String Matching, Text Similarity |
Output | Inference result set only | Output content already generated by the model | When reusing existing inference results |
Data Volume Recommendations
The data volume directly affects the reliability of evaluation results. Choose an appropriate data scale based on your evaluation objective:
- Quick validation (50-100 entries): suitable for quick result confirmation after Prompt tuning, can complete evaluation in a short time.
- Standard evaluation (200-500 entries): suitable for model selection and formal evaluation, covers more scenarios, results are more representative.
- In-depth evaluation (500 entries or more): suitable for scenarios that require high evaluation precision, can fully cover the distribution of business questions.
When writing Prompts, cover typical scenarios and edge cases in your business and avoid concentrating on a single type of question. Each Prompt should be clear and specific so that the model's performance in real usage can be assessed.
Create a Dataset
Follow these steps to create an evaluation dataset in the console:
- Log in to the Alibaba Cloud Model Studio console.
- In the left navigation pane, choose Data Management > Dataset Management.
- Click Create Dataset.
- Fill in the Dataset Name, and in Dataset Type select Evaluation Set.
- Upload a data file or manually add data entries, ensuring that each entry contains at least the Prompt field.
- Click OK to complete the creation.
Create an Evaluation Dimension
An evaluation dimension defines the scoring criteria for model output. Each dimension is bound to one scoring method. When an evaluation task runs, each entry is scored one by one according to the dimension configuration.
ImportantThe scoring method of an evaluation dimension cannot be changed after creation. To use a different scoring method, create a new evaluation dimension.
Select a Scoring Method
Alibaba Cloud Model Studio supports the following 5 scoring modes (see What is Model Evaluation for details). The key parameters of each method are as follows:
LLM Numerical Scoring: the judge model outputs a numerical score according to the Scorer Prompt. The scoring range defaults to 0-5 (minimum 0, maximum customizable). The pass threshold defaults to 3.0 (a score ≥ the threshold is considered a pass). Qwen-Max (qwen-max) is recommended as the judge model; its scoring stability and discriminative power are superior.
LLM Classification Scoring: the judge model assigns the output to predefined category labels according to the Scorer Prompt. You need to configure at least two category labels (such as Pass and Fail) and specify which labels are considered "pass". Pass labels and not-pass labels must not overlap.
NoteWhen configuring category labels, pass labels and not-pass labels must be mutually exclusive. For example, Pass and Fail cannot both be marked as pass labels, otherwise the system will reject the creation.
String Matching: performs string comparison between the model output and the Completion reference answer, without involving a judge model. Supported matching rules include: equal, not equal, contains, starts with, ends with.
Text Similarity: uses algorithms to compute the similarity score between the model output and the Completion reference answer, without involving a judge model. Supported algorithms include: ROUGE-L (recall-oriented), BLEU (precision-oriented), Cosine (semantic similarity), Fuzzy (fuzzy match), and Accuracy (exact match rate).
Manual Classification Scoring: scoring is performed manually by an annotator rather than a judge model. The parameter configuration is similar to LLM Classification Scoring; you need to define category labels and pass labels.
The configuration parameters of each scoring method are as follows (some parameters are only displayed under specific scoring methods):
Parameter | Description | Required | Value Description |
|---|---|---|---|
Dimension name | Identifying name of the evaluation dimension | Yes | No more than 20 characters |
Dimension description | Textual description of the dimension | Yes | No more than 100 characters |
Scoring method | Determines how the model output is evaluated | Yes | One of the 5 scoring methods; cannot be changed after creation |
Judge model | The LLM that scores the model output | Required for LLM scoring | Qwen-Max (qwen-max) recommended |
Scorer Prompt | Instruction that guides the judge model in scoring | Required for LLM scoring | Supports variables ${prompt}/${output}/${completion} |
Scoring range | Score interval for numerical scoring | Required for LLM Numerical Scoring | Defaults to 0-5; maximum value is customizable |
Pass threshold | A score greater than or equal to the threshold is considered a pass | Required for LLM Numerical Scoring | Default 3.0, supports 0.1 step |
Category label | Predefined category labels | Required for classification scoring | At least two labels; pass and not-pass must not overlap |
Similarity algorithm | Algorithm for computing text similarity | Required for Text Similarity | ROUGE-L / BLEU / Cosine / Fuzzy / Accuracy |
Similarity threshold | Pass mark for the similarity score | Required for Text Similarity | ROUGE-L recommended 0.4-0.6, BLEU recommended 0.3-0.5 |
Annotation guideline | Instructions that guide annotators in judging | Optional for Manual Classification Scoring | Custom text description |
Configure a Scorer Prompt
LLM Numerical Scoring and LLM Classification Scoring require a Scorer Prompt to guide the judge model on how to score. You can choose a Prompt template preset by the platform or write a custom Prompt.
The Scorer Prompt supports the following three variables, which are automatically replaced with actual data during evaluation:
${prompt}: the Prompt input content of the current data entry.${output}: the output content generated by the model to be evaluated for this Prompt.${completion}: the Completion reference answer for this data entry (if any).
When customizing a Prompt, clearly tell the judge model the judgment criteria, output format, and scoring range of the scoring dimension to obtain stable scoring results. For more Prompt writing techniques, see Prompt Best Practices.
Steps to Create a Dimension
- Log in to the Alibaba Cloud Model Studio console, and in the left navigation pane choose Evaluation > Dimension.
- Click Create Evaluation Dimension.
- Fill in the Dimension Name (no more than 20 characters) and the Dimension Description (no more than 100 characters).
- In Scoring Method, select a scoring method and configure the corresponding parameters.
- If you select an LLM scoring method, choose a model in Judge Model (Qwen-Max recommended) and configure the Scorer Prompt.
- Click OK to complete the creation. The scoring method cannot be changed after creation; to use a different scoring method, create a new dimension.

For detailed configuration parameters and usage recommendations for each scoring method, see Select a Scoring Method.
Create an Evaluation Task
An evaluation task combines the model to be evaluated, evaluation data, and evaluation dimensions for execution. When the task runs, the platform sends each Prompt in the dataset to the model to be evaluated to obtain the output, and then scores each one according to the associated evaluation dimensions.
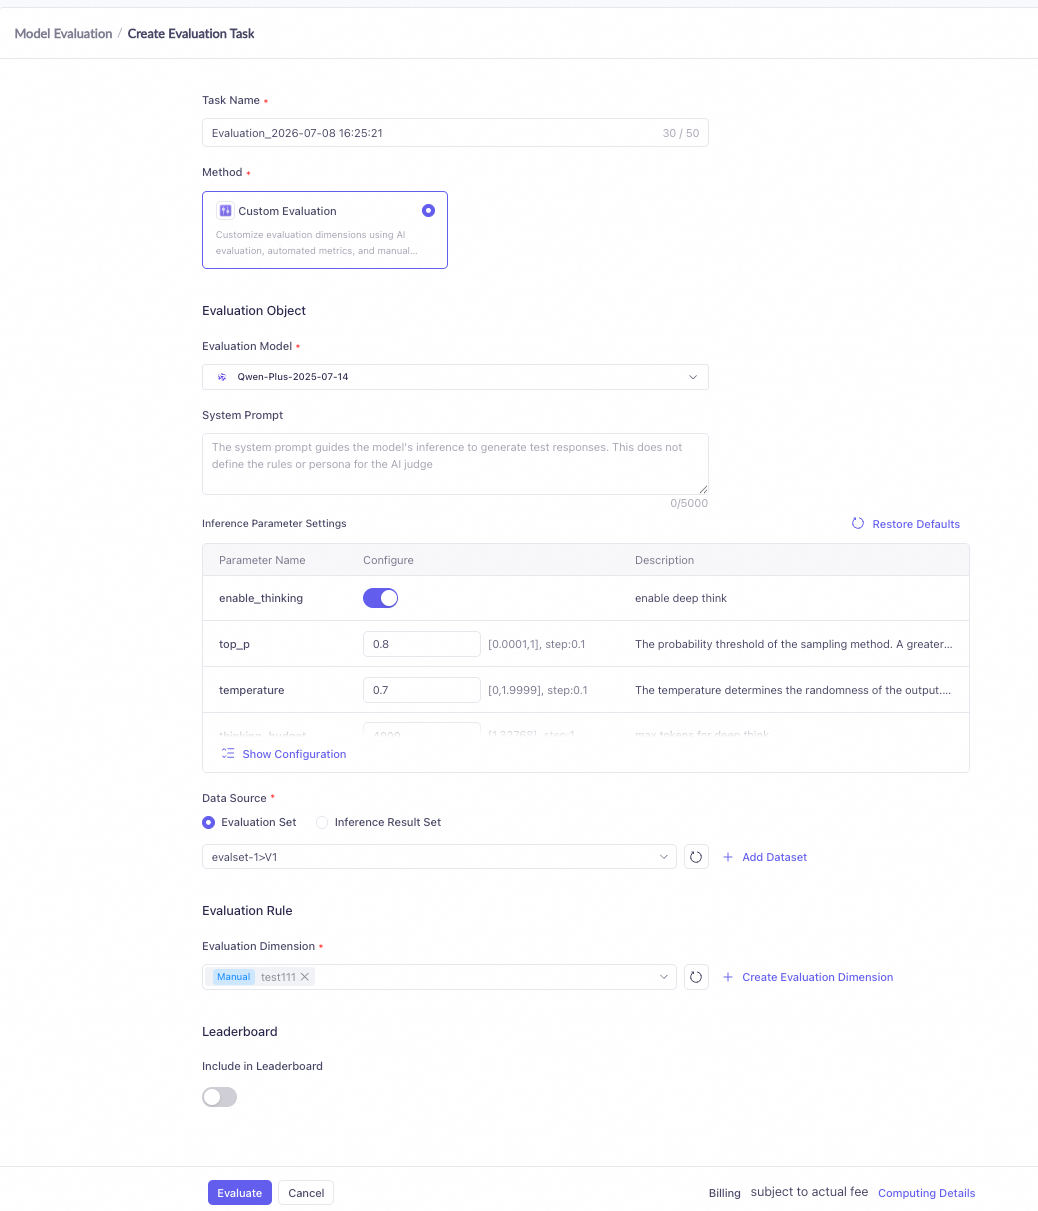
Configure Evaluation Task Parameters
- Log in to the Alibaba Cloud Model Studio console, and in the left navigation pane choose Evaluation > Evaluation Task.
- Click Create Evaluation Task.
- Fill in the Task Name (no more than 50 characters; default name format is "Evaluation_CurrentTime").
- In Model to Be Evaluated, select one or more models. Models shown in gray in the drop-down list are not currently supported for evaluation and cannot be selected.
- Select the Data Source: choose Evaluation Set or Inference Result Set, and associate the dataset you have created (see Prepare Evaluation Data for details).
- In the Dimension area, associate one or more evaluation dimensions you have created. If you clear the selected dimensions, the leaderboard association settings will also be cleared automatically.
- If you need to set a System Prompt, fill it in the corresponding area. Click OK to submit the task.
ImportantAfter an evaluation task is submitted, the model to be evaluated cannot be changed. To evaluate other models, create a new evaluation task.
System Prompt vs. Scorer Prompt
Two types of Prompts are involved in an evaluation task, with different target objects:
- System Prompt: configured in the evaluation task and sent to the model to be evaluated as a system instruction. It is used to set the role, output format, or behavior constraints of the model to be evaluated and affects the model's output.
- Scorer Prompt: configured in the evaluation dimension and sent to the judge model as the scoring basis. It guides the judge model on how to score the output of the model to be evaluated, and is used only by LLM scoring methods.
The two do not affect each other: the System Prompt controls "what the model to be evaluated outputs", and the Scorer Prompt controls "how the judge model scores".
Comparison Item | System Prompt | Scorer Prompt |
|---|---|---|
Configuration location | Configured in the evaluation task | Configured in the evaluation dimension |
Target object | Model to be evaluated | Judge model |
Purpose | Set the model role, output format, or behavior constraints | Guide the judge model on how to score the output |
Required | Optional | Required for LLM scoring methods |
Fee attribution | Counted toward the inference fee of the model to be evaluated | Counted toward the scoring fee of the judge model |
Leaderboard Participation Settings
When creating an evaluation task, you can set whether the task results participate in leaderboard ranking. After it is enabled, the evaluation results will automatically flow into the leaderboard when the task is completed, and will be compared and displayed alongside the evaluation results of other models.
When creating an evaluation task from the Leaderboard page entry, the system automatically fills in the evaluation dimensions and dataset associated with the leaderboard. You only need to select the model to be evaluated to submit the task.
View Evaluation Results
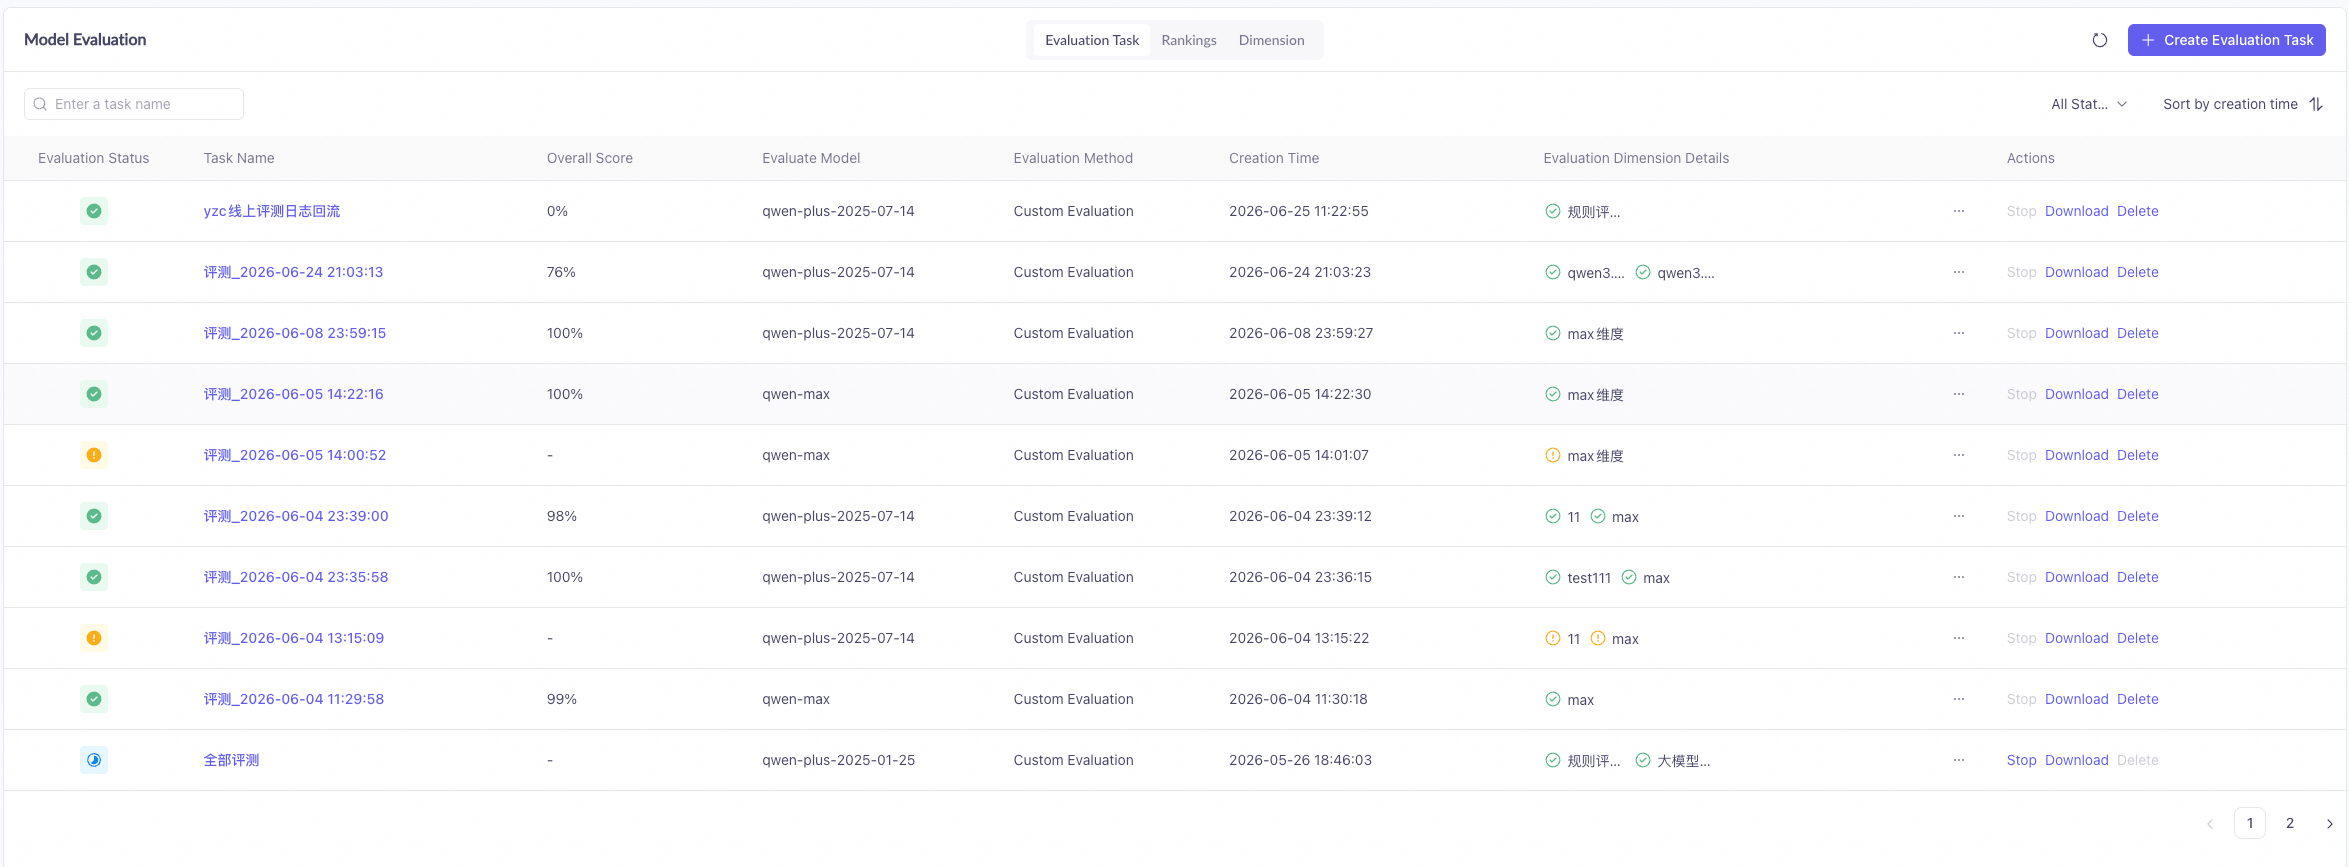
After a task is submitted, you can track the task status and view the evaluation results in the evaluation task list.
Log in to the Alibaba Cloud Model Studio console, and in the left navigation pane choose Evaluation > Evaluation Task.
Task Status
The status of an evaluation task changes as follows:
- WAITING: the task has been submitted and is waiting for execution.
- RUNNING: the task is being executed, and the platform is calling the model and scoring.
- FINISH: the task execution is complete, all data has been scored, and results can be viewed.
- FAILED: the task execution failed, usually caused by a model invocation exception or a data format issue.
- ABORTED: the task was manually terminated.
For available operations under each status, see Manage Evaluation Resources.
View Evaluation Data and Statistics
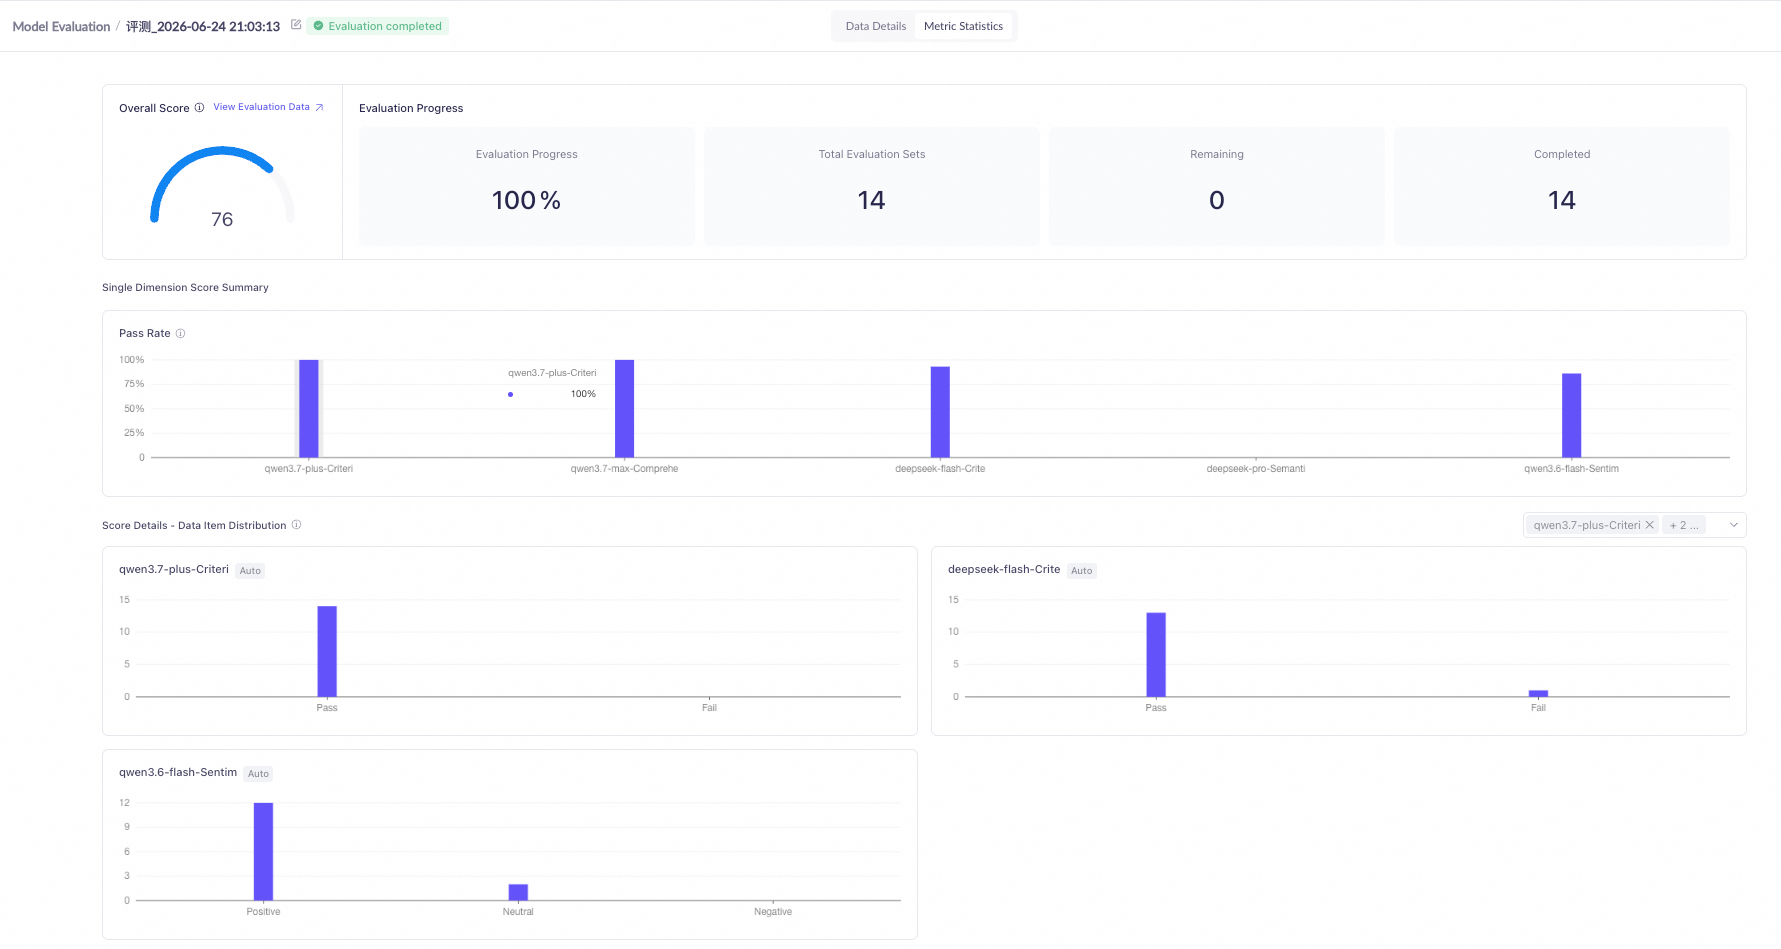
After the task status becomes FINISH, click the task name to enter the result details page, which contains the following two tabs:
- Data Details: displays the Prompt, model output, and score of each dimension for each data entry one by one, helping you locate the model's performance on specific questions.
- Metric Statistics: displays the comprehensive score and pass rate of each evaluation dimension. Numerical dimensions show the average score and pass rate; categorical dimensions show the distribution chart of each category label.
Result Download and Analysis
Only tasks with status FINISH support result download. On the evaluation task details page, click Download Results to export the complete evaluation data.
When analyzing evaluation results, pay attention to the following aspects:
- Compare the score differences of different models on the same dimension to determine the strengths of each model.
- Filter low-score data entries and analyze on which types of questions the model performs poorly.
- Focus on the pass rate metric: the pass rate reflects the proportion of the model reaching the baseline on that dimension, and is a core reference for model selection.
- If the same model is evaluated multiple times, compare the score changes across periods to track the effect of model tuning.
Use Leaderboards to Compare Models
Leaderboards are used to compare the performance of multiple models under the same evaluation dimensions, and visually display the strengths and weaknesses of each model in the form of rankings. Each leaderboard is bound to a set of evaluation dimensions, and aggregates the results of multiple evaluation tasks into the same ranking table, helping you quickly make model selection decisions.
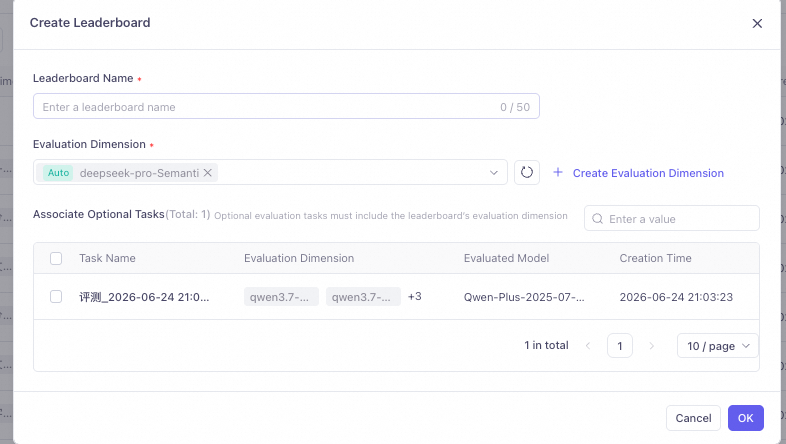
Create a Leaderboard
- Log in to the Alibaba Cloud Model Studio console, and in the left navigation pane choose Evaluation > Leaderboard.
- Click Create Leaderboard.
- Fill in the Leaderboard Name (no more than 50 characters).
- In Dimension, select one or more evaluation dimensions you have created. The evaluation dimensions bound to a leaderboard cannot be modified after creation; choose carefully.
- Click OK to complete the creation.
Add Evaluation Tasks to a Leaderboard
After a leaderboard is created, you can add evaluation tasks to the leaderboard in two ways:
- Create a new task from the leaderboard: on the leaderboard details page, click Create Evaluation Task. The system automatically locks the evaluation dimensions bound to the leaderboard and associates the leaderboard. You only need to select the model to be evaluated and the dataset.
- Select from completed tasks: on the leaderboard details page, click Add Evaluation Task, and in the pop-up list, check the historical tasks whose status is FINISH and that contain the leaderboard's evaluation dimensions. Tasks already bound to the current leaderboard have their check boxes grayed out and cannot be unchecked.
Up to 50 evaluation tasks can be added to each leaderboard.
Leaderboard Results Description
The leaderboard displays the ranking results of all added tasks in a table, containing the following columns:
- Ranking: arranged from high to low by leaderboard score, the top three are marked in gold, silver, and bronze.
- Task Name: the name of the evaluation task. Click to jump to the task details.
- to compare: the name of the model to be evaluated used by the task.
- Leaderboard Score: the value range is 0-100, derived from normalizing the task's scores on the dimensions bound to the leaderboard. The score of a task being evaluated is displayed as a dash (-) and will be automatically updated after the evaluation is completed.
- [Evaluation Dimension Name]: displays the original score of the task on the dimensions bound to the leaderboard.
- Actions: supports viewing task details or removing the task from the leaderboard.
Leaderboard scores are updated in real time as the evaluation task progresses. When the task status becomes FINISH, the ranking will be automatically refreshed.
Manual Annotation Evaluation
Manual annotation evaluation is suitable for scenarios that require subjective judgment, such as creativity evaluation and professional quality review. When automatic scoring methods cannot accurately measure the quality of model output, you can create an evaluation task that contains a manual classification scoring dimension, and annotators will manually judge the model output one by one.
Log in to the Alibaba Cloud Model Studio console, and in the left navigation pane choose Evaluation > Evaluation Task.
Annotation Modes
Manual annotation supports 3 modes, applicable to different evaluation objectives:
Single Annotation
Single Annotation (base) mode scores the model output of each data entry one by one, and the annotator selects a category label for each output. It is suitable for scenarios that require independent scoring of each output, such as checking the accuracy or safety of model answers one by one.
Comparative Annotation
Comparative Annotation (PK) mode displays the outputs of two models for the same Prompt side by side, and the annotator ranks the two outputs (such as A is better than B). It is suitable for direct comparison and selection between models, helping quickly determine which model performs better in a specific scenario.
Application Annotation
Application Annotation (app) mode evaluates the quality of model output in real application scenarios, and annotators make judgments based on business context. It is suitable for application-level end-to-end effectiveness evaluation, focusing on the usability of the model output in real business flows.
A comparison of the 3 annotation modes is as follows:
Annotation Mode | Description | Applicable Scenarios |
|---|---|---|
Single Annotation (base) | Score each model output one by one | Needs to independently score each output |
Comparative Annotation (PK) | Compare and rank two model outputs side by side | Direct comparison and selection between models |
Application Annotation (app) | Evaluate model output in application scenarios | End-to-end effectiveness evaluation |
Annotation Steps
- Follow the Create an Evaluation Task workflow to create a new task and associate an evaluation dimension whose scoring method is Manual Classification Scoring (see Create an Evaluation Dimension for details).
- After the task is created, go to the task details page and select the Evaluation Data tab.
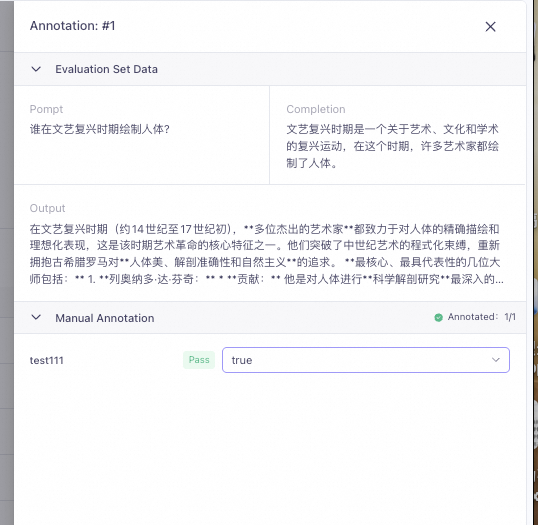
- In the Actions column of the data list, click the Annotate button to enter the annotation page.
- Review the model output content, select a category label for this data entry according to the judgment criteria, and click Submit to complete the annotation of the current entry.
- Complete the annotation of all data entries one by one. When all data is annotated, the task status automatically changes to FINISH.
Label Design Recommendations
The quality of label design directly affects the reliability of annotation results. The following principles are recommended:
- Labels should cover all possible model output situations to prevent annotators from encountering outputs that cannot be categorized.
- Use concise and clear category words as label names to reduce the annotator's comprehension cost.
- Arrange multiple annotators to cross-annotate the same batch of data to check annotation consistency. If the consistency is low, check whether the label definitions are ambiguous and optimize the judgment criteria.
Manage Evaluation Resources
After evaluation tasks, evaluation dimensions, and leaderboards are created, you can manage these resources in the console. Some operations are irreversible; proceed with caution.
Log in to the Alibaba Cloud Model Studio console, and in the left navigation pane choose Evaluation.
Evaluation Task Management
On the Evaluation > Evaluation Task list page, you can perform the following operations on evaluation tasks:
- Search, filter, and sort: search by task name, filter by status, and sort by creation time to quickly locate the target task. These operations only affect the list display and do not change the task data.
- Terminate task: only tasks with status RUNNING support termination. After clicking Terminate, the task status changes to ABORTED. This operation is irreversible.
- Delete task: tasks with status FINISH, FAILED, or ABORTED can be deleted. After deletion, the task data and evaluation results will be permanently cleared. This operation is irreversible.
- Download results: only tasks with status FINISH support downloading evaluation results (see View Evaluation Results for details).
The available operations under each task status are summarized as follows:
Task Status | Available Operations | Irreversible Reminder |
|---|---|---|
WAITING | None (task is queuing) | - |
RUNNING | Terminate | After termination, the status changes to ABORTED and cannot be restored |
FINISH | View results, Download results, Delete | Data is permanently cleared after deletion |
FAILED | Delete | Data is permanently cleared after deletion |
ABORTED | Delete | Data is permanently cleared after deletion |
Evaluation Dimension Management
On the Evaluation > Dimension list page, you can edit the dimension description or delete a dimension.
When deleting an evaluation dimension, if the dimension has been bound to a leaderboard, the score data based on that dimension in the leaderboard will be cleared. Please confirm whether any leaderboard is using the dimension before deletion.
Leaderboard Management
On the Evaluation > Leaderboard list page, you can perform the following operations:
- Delete leaderboard: after a leaderboard is deleted, the leaderboard data will be permanently cleared, but the evaluation tasks already added to the leaderboard are not affected.
- Remove task: on the leaderboard details page, you can remove an evaluation task from the leaderboard. The removal only affects the leaderboard display; the evaluation task itself and its results will not be deleted.
WarningThe following operations are irreversible; confirm before executing: deleting an evaluation task will permanently clear the task data and evaluation results; a terminated task cannot be resumed; deleting an evaluation dimension will also clear the score data based on that dimension in the leaderboard.
Billing
The fees generated by Model Evaluation consist of two parts: the inference fee of the model to be evaluated and the scoring fee of the judge model. Understanding the billing rules helps you plan the evaluation scale and control costs appropriately.
Fee Composition
Inference fee of the model to be evaluated: billed by token. The formula is cost = input_tokens x input_price + output_tokens x output_price. Here, input_tokens includes the System Prompt and the Prompt of each data entry, and output_tokens is the answer generated by the model. The specific unit price of each model is subject to the Model Studio console.
Scoring fee of the judge model: only incurred when using the LLM Numerical Scoring or LLM Classification Scoring scoring method. The tokens consumed by the judge model for scoring each data entry are billed according to the pricing of that judge model. For specific prices, refer to the Model Studio console.
When using the String Matching or Text Similarity scoring method, the scoring process does not involve a judge model call, so no scoring fee is incurred.
NoteString Matching and Text Similarity scoring methods do not call a judge model and do not incur scoring fees; only the inference fee of the model to be evaluated is charged. For evaluation scenarios with a clear standard answer, prioritizing these two methods can significantly reduce the evaluation cost.
For independently deployed models (fine-tuned and deployed online), no additional inference fee is charged during evaluation; only the existing deployment fee applies.
The fee composition of each scoring method is summarized in the following table:
Scoring Method | Inference Fee of Model to Be Evaluated | Scoring Fee of Judge Model | Fee Composition |
|---|---|---|---|
LLM Numerical Scoring | Billed by token | Billed by token | Inference + Scoring |
LLM Classification Scoring | Billed by token | Billed by token | Inference + Scoring |
String Matching | Billed by token | None | Inference only |
Text Similarity | Billed by token | None | Inference only |
Manual Classification Scoring | Billed by token | None (manual cost is calculated separately) | Inference + Manual |
Fee Estimation Example
The following example shows the fee estimation process for using the qwen-plus model to perform LLM Numerical Scoring evaluation on 100 data entries (the unit price is for illustration only; refer to the actual display in the console):
- Assume that each data entry averages input_tokens = 500 and output_tokens = 200.
- Inference fee of the model to be evaluated = 100 x (500 x input_price + 200 x output_price).
- Scoring fee of the judge model = 100 x (tokens consumed per scoring x unit price of the judge model).
- Total fee = Inference fee of the model to be evaluated + Scoring fee of the judge model.
Cost Optimization Strategies
- Phased evaluation: first use 50-100 data entries for small-scale validation. After confirming that the evaluation dimensions and data quality meet expectations, scale up to the full dataset for formal evaluation.
- Rule-based evaluation first: String Matching and Text Similarity do not incur judge model fees and have the lowest cost. For scenarios with a clear standard answer, prioritize rule-based evaluation methods.
- Save inference result sets for reuse: save the model inference results as an inference result set. Subsequent evaluations can directly use the existing results, avoiding the cost of repeatedly calling the model for inference.
FAQ
What if the evaluation results do not meet expectations?
Problem: after the evaluation task is completed, the model score shows a significant deviation from the actual experience, or the scoring result is unreasonable.
Check the following aspects in turn:
- Check the representativeness of the test data: confirm whether the evaluation dataset covers the typical scenarios and edge cases of the business. Too little data or a skewed distribution will make the scores unrepresentative.
- Review the clarity of the Scorer Prompt: confirm whether the Scorer Prompt clearly describes the scoring criteria and judgment basis. An ambiguous Prompt will cause the judge model to score unstably.
- Adjust the scoring range and threshold: too narrow a scoring range (such as 0-2) may result in insufficient score discrimination. Appropriately widening the range (such as 0-10) can improve scoring precision.
- Change the judge model: different judge models have different scoring capabilities. Qwen-Max (qwen-max) is recommended for more stable scoring results.
What if the scores are too concentrated?
Problem: the scores of multiple data entries are concentrated on the same score or category label, lacking discrimination.
Overly concentrated scores are usually caused by the following reasons. Investigate them one by one:
- Refine the judgment criteria: add clear judgment conditions and examples for each score tier in the Scorer Prompt so that the judge model can distinguish outputs of different quality levels.
- Increase data diversity: add boundary samples and abnormal samples to the evaluation dataset to prevent all Prompts from being too uniform in difficulty.
- Change the judge model: a judge model with stronger reasoning ability (such as Qwen-Max) can better follow the fine-grained judgment criteria in the Scorer Prompt.
How to interpret contradictory results across different evaluation dimensions?
Problem: the same model has large score differences across different evaluation dimensions, and may even perform excellently on one dimension and poorly on another.
This is normal. Different evaluation dimensions evaluate different aspects of the model's capabilities (such as accuracy, fluency, and logic). The model's performance across different capabilities inherently varies. It is recommended to make weighted decisions on the dimension scores based on business priorities, rather than requiring the model to perform optimally on all dimensions.
What if the model frequently outputs outdated or irrelevant content?
Problem: the model output is irrelevant to the reference answer, or contains outdated information, resulting in a low evaluation score.
This usually indicates that the model's knowledge coverage is insufficient or the training data is lagging. It is recommended to consider introducing a knowledge base to supplement the model with domain knowledge, and to improve the model's output quality in specific domains through Retrieval-Augmented Generation (RAG).
What are the common pitfalls when using evaluation?
Problem: when using Model Evaluation for the first time, it is easy to confuse concepts or misoperate, resulting in abnormal evaluation results.
The following are common pitfalls and correct practices:
- System Prompt is not the same as Scorer Prompt: the System Prompt is configured in the evaluation task and sent to the model to be evaluated; the Scorer Prompt is configured in the evaluation dimension and sent to the judge model (see Create an Evaluation Task for details). The two target different objects; do not confuse them.
- Category labels such as Pass/Fail must not overlap: in dimensions that use LLM Classification Scoring or Manual Classification Scoring, pass labels and not-pass labels must be mutually exclusive. The same label cannot belong to both groups at the same time.
- No additional fee for independently deployed models: models that have been fine-tuned and deployed online are not charged an additional inference fee during evaluation (see Billing for details).
- Dataset type restriction: evaluation tasks only support datasets of the Evaluation Set type. If a dataset of the training set type is selected, the system will refuse to create the evaluation task.