The data analysis feature supports statistical analysis of mini program usage data for the current App. Through the data overview page, you can understand the historical statistical data (T+1) and real-time data overview of a single mini program.
To view the data overview, follow these steps:
In the Mini Program Open Platform > Developer Backend, enter Data Statistics > Data Overview page from the navigation pane on the left.
From the dropdown box in the upper left corner of the page, select the target mini program. By default, the system displays the analytical data of the most recently created mini program.
Click the Overview Statistics or Real-time Dashboard tab to view the historical or real-time statistical data of the mini program. The analytical data appears in the form of metric cards and line trend charts.
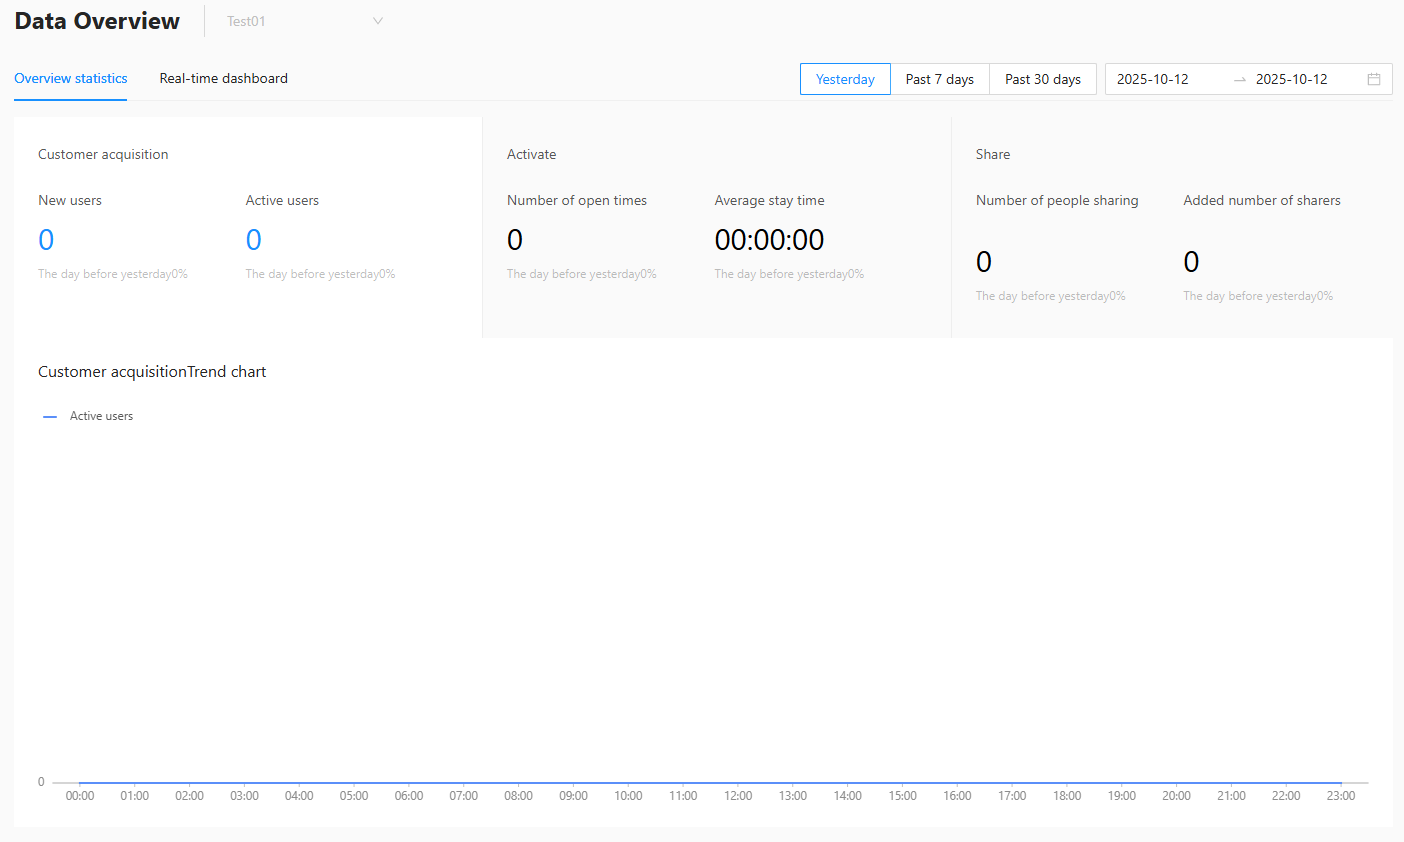
Overview statistics
The overview statistics page displays the core data metrics and trend changes of "Customer Acquisition > Activation > Sharing" for the currently selected mini program. You can view the data performance and value conversion of the current mini program, and identify data issues and locate abnormal data. The page supports selecting metric data for any past 1 day, 7 days, or 30 days.
Metric overview
Displays the historical statistical data of core metrics for the current mini program in the three stages of customer acquisition, activation, and sharing during the specified time period in card format. This includes new users, active users, number of opens, average stay duration per open, number of sharing users, number of new users from sharing, along with the growth rate compared to the previous day, same period last week, or same period last month.
Line trend chart
Displays the change trend of various metric data during the specified time period in the form of a line chart. When you click a metric card, the line chart will display the data trend of the corresponding metric on the card.
Real-time dashboard
The real-time dashboard displays the real-time statistical data of five core metrics for the currently selected mini program, and the hourly change trend of each metric.
Metric overview
Displays the real-time data of various metrics for the current mini program in card format, including active users, number of opens, page visit count, average duration per open, average duration per user, and the growth rate compared to the same period yesterday.
Line trend chart
Displays the change trend of various metric data for today, yesterday, and 7 days ago in the form of a line chart. When you click a metric card, the line chart will display the data change trend of the corresponding metric.
Metric description
The descriptions of various metrics in the data overview are as follows.
Metric | Description |
New Users | The number of users who visit the mini program page for the first time. Multiple visits by the same user are not counted repeatedly. |
Active Users | The total number of users who visit the mini program. Multiple visits by the same user are not counted repeatedly. |
Number of opens | The total number of times the mini program is opened. A user opening the mini program until it exits to the background is counted as one time. When the interval between two consecutive opens of the mini program is less than 30 seconds, it is counted as one open. |
Average duration per open | During the selected time period, the total duration of staying on the mini program page for each open on average, that is, average stay duration per open = total stay duration of all users/number of opens. |
Average duration per user | The total duration of staying on the mini program page for each user on average, that is, average stay duration per user = total stay duration/number of active users. |
Number of sharing users | The total number of people who share the mini program page. Multiple shares by the same user are not counted repeatedly. |
Number of new users from sharing | The number of new users who enter the mini program for the first time through a shared link. |
Previous day (%) | The growth rate of the cumulative data of the selected day compared to the cumulative data of the previous day. Previous day comparison = (data of the specified date - data of the previous day)/data of the previous day. When the divisor is 0, it is calculated as 1. Integer digits are retained before the percentage sign. |
Same period yesterday (%) | The growth rate of the cumulative data from 0:00 to the current hour compared to the cumulative data of the same time yesterday. |
Same period last week (%) | The growth rate of the cumulative data of the past 7 days compared to the cumulative data of the past 8-14 days. Same period last week = (data of the past 7 days - data of the same period last week)/data of the same period last week. When the divisor is 0, it is calculated as 1. Integer digits are retained before the percentage sign. |
Same period last month (%) | The growth rate of the cumulative data of the past 30 days compared to the cumulative data of the past 31-60 days. Same period last month = (data of the past 30 days - data of the same period last month)/data of the same period last month. When the divisor is 0, it is calculated as 1. Integer digits are retained before the percentage sign. |