LogView 2.0 lets you monitor MaxFrame jobs in real time — tracking every directed acyclic graph (DAG) submitted in a session, drilling into sub DAG topology and operator details, and inspecting CPU and memory usage per instance.
For general LogView 2.0 capabilities, see Use LogView 2.0 to view job running information.
Quick navigation
| I want to… | Go to |
|---|---|
| Find the slowest DAG, sub DAG, or instance | View the longest-running items |
| Diagnose a job failure | View the cause of an error |
| Inspect operators in a sub DAG | View operators in a sub DAG |
| Explore data flow between operators | View data flow structure |
| Check a table schema | View the structure of a data table |
| View instance-level job details | View job details |
Open LogView
When you create a MaxFrame session with session = new_session(...), MaxCompute automatically generates a LogView URL starting with https://logview.aliyun.com/logview.
-
DataWorks console: Click the URL that appears after submitting a job.
-
Local environment: Call
session.get_logview_address()to print the URL, then open it in a browser.
The MaxFrame LogView page has three main areas:
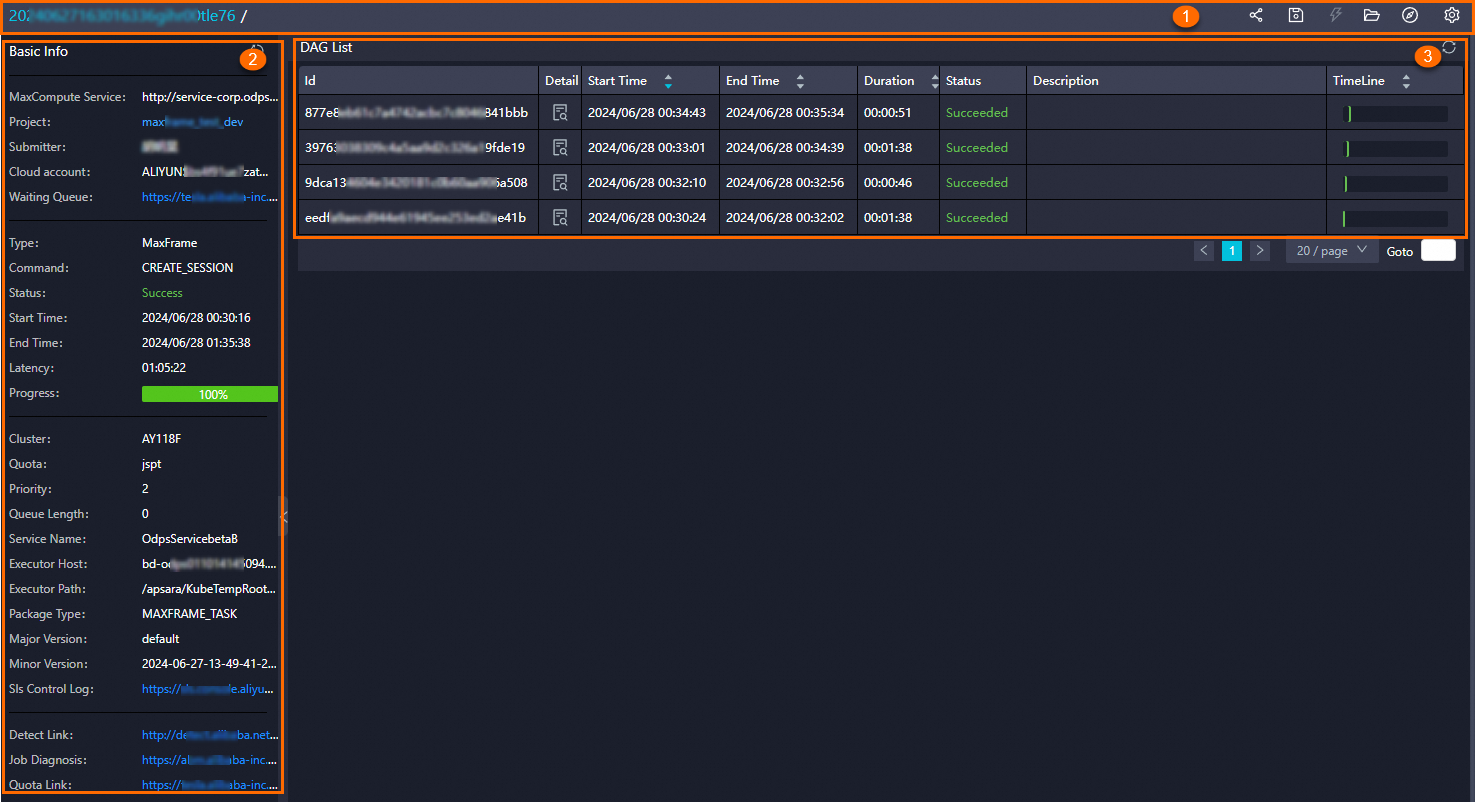
| Area | Description |
|---|---|
| ① | Title and function section — displays the job ID and job name. See Title and function section. |
| ② | Basic Info. See Basic Info. |
| ③ | DAG List. See DAG List. |
Title and function section
This section shows the job ID (a unique identifier) and the job name (a custom label you assign). The icons on the right give you quick access to common actions:
| Icon | Action |
|---|---|
| ![icon]() | Obtain the MaxFrame LogView URL. |
| ![icon]() | Save job details to a file on your machine. |
| ![icon]() | Stop the current job. |
| ![icon]() | Open the LogView_detail.txt file saved on your machine. |
| ![icon]() | Open the job list and view the job information under the specified project. |
| ![icon]() | Toggle auto-refresh. When enabled, the page refreshes every 10 seconds. |
DAG List
The DAG List shows all DAGs submitted in MaxFrame sessions, sorted with the most recent at the top.
| Parameter | Description |
|---|---|
| Id | Unique ID generated each time the DAG runs. |
| Detail | Click the icon to open the sub DAG details page. |
| Start time | Time the DAG was submitted. |
| End time | Time the DAG finished. Empty if the DAG is still running. |
| Duration | Elapsed time from start to end, or from start to now if still running. |
| Status | Current state: Preparing, Running, Succeeded, Failed, Cancelling, or Cancelled. |
| Description | Description of the DAG. |
Sub DAG details
Click the Detail icon in the DAG List to open the sub DAG details page.
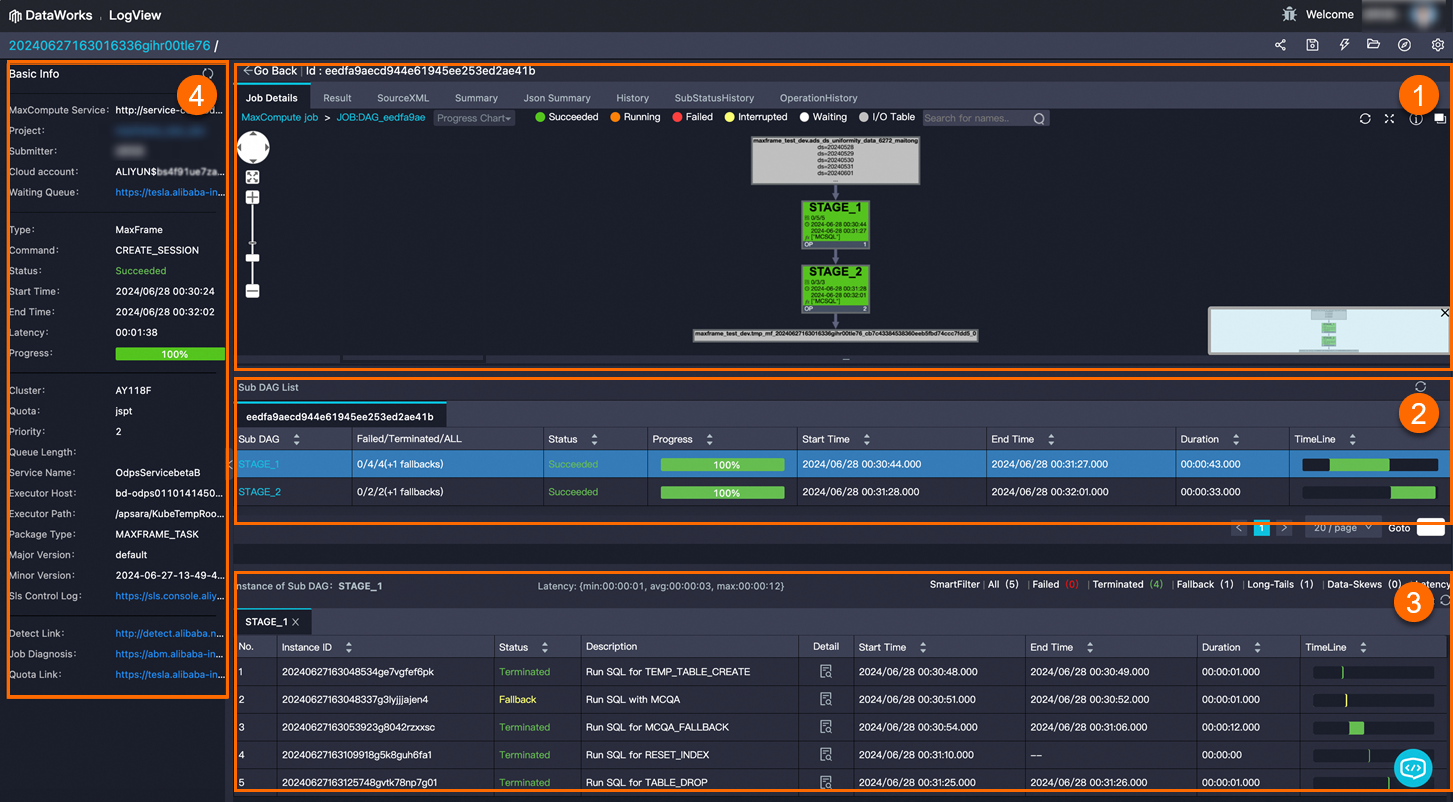
| Area | Description |
|---|---|
| ① | Sub DAG Graph. See Sub DAG graph. |
| ② | Sub DAG list. See Sub DAG list. |
| ③ | Instance list. See Instance list. |
| ④ | Basic Info of the sub DAG. See Basic Info. |
Sub DAG graph
The sub DAG graph visualizes the execution topology of the current DAG.
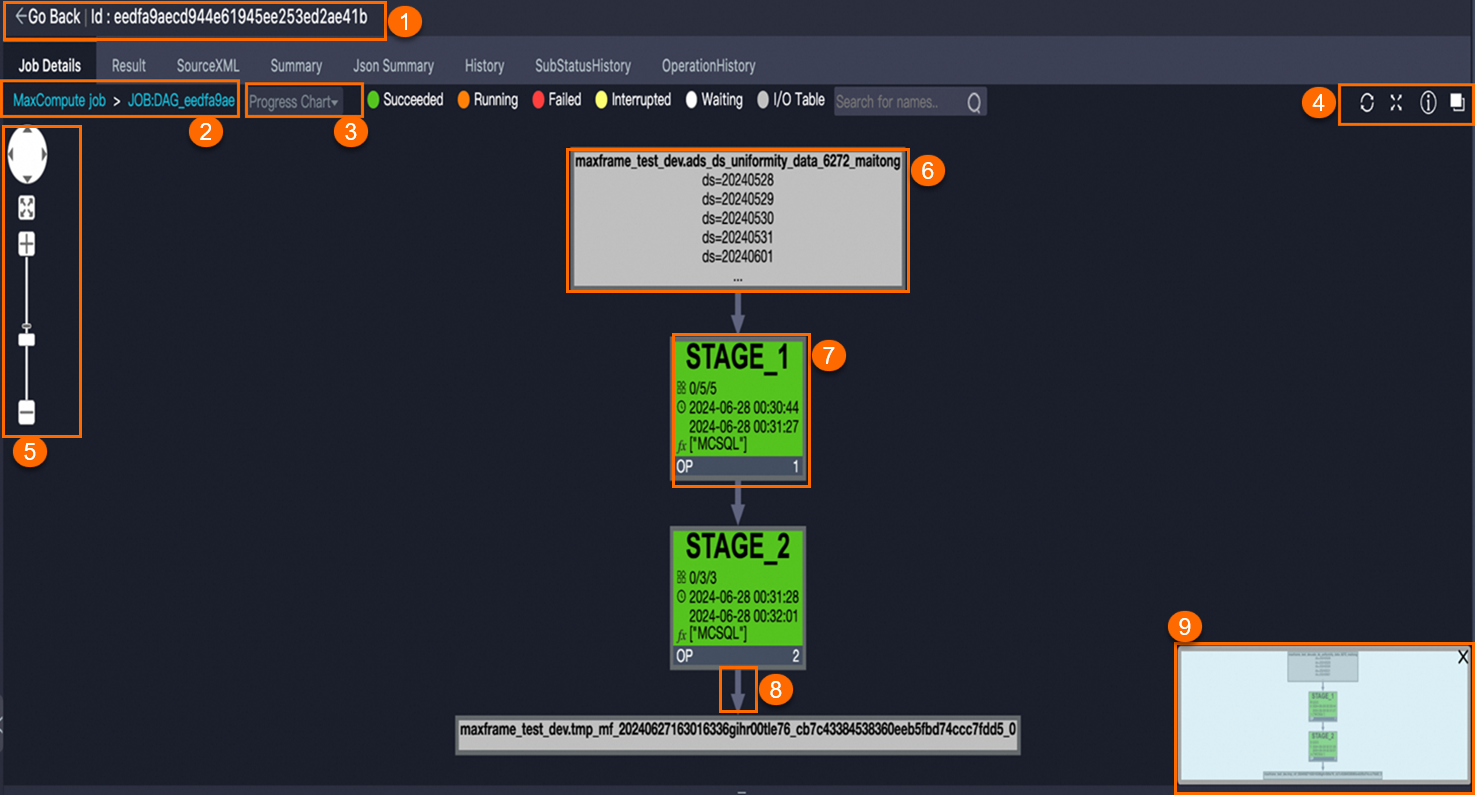
| Element | Description |
|---|---|
| ① | Sub DAG ID. Click to return to the DAG List page. |
| ② | Breadcrumb navigation for switching between task levels. |
| ③ | Troubleshooting tools: Progress Chart, Input Heat Chart, Output Heat Chart, TaskTime Heat Chart, and InstanceTime Heat Chart. |
| ④ | Toolbar: refresh job status, toggle full screen or zoom, open MaxCompute Studio documentation, go up one task level. |
| ⑤ | Zoom control. |
| ⑥ | Table node — represents a MaxCompute table. |
| ⑦ | Sub DAG node — contains: STAGE_X (name; X = execution order, starting from 1), X/X/X (running/completed/total instances, e.g., 0/5/5), start and end times, MCSQL (execution engine), and OP N (operator count; double-click to view the operator graph). |
| ⑧ | Data flow arrows — show the direction of data between stages and tables. |
| ⑨ | Canvas preview. |
Sub DAG list
The sub DAG list shows all sub DAGs in the current DAG, sorted chronologically.

| Parameter | Description |
|---|---|
| Sub DAG | Name of the sub DAG. |
| Failed/Terminated/ALL | Instance counts by state. If (+X fallbacks) appears, X instances running as MaxCompute Query Acceleration (MCQA) jobs were rolled back to offline SQL — this is expected behavior, not a data error. |
| Status | Running, Succeeded, Failed, or Cancelled. |
| Progress | Execution progress. A progress of 100% with status Running means all instances have finished, but the sub DAG itself may still be completing. |
| Start time | Time the sub DAG was submitted. |
| End time | Time the sub DAG finished. |
| Duration | Running duration of the sub DAG. |
| Timeline | Visual bar showing start sequence and duration across sub DAGs. Use it to spot which sub DAG is blocking the overall job or causing the longest wait. |
Instance list
The instance list shows MaxCompute instances associated with the selected sub DAG.

| Parameter | Description |
|---|---|
| Instance ID | MaxCompute instance ID. |
| Status | Running, Terminated (completed successfully), Failed, Cancelled, Fallback (degraded to a new instance), or Unknown_terminated (completed but success/failure could not be determined). |
| Detail | Click to view instance-level job details. |
| Start time | Time the instance was submitted. |
| End time | Time the instance finished. |
| Duration | How long the instance ran. |
| Timeline | Visual bar showing start sequence and duration across instances. Use it to identify instances with unusually long run times or uneven load distribution. |
Fuxi Sensor
Fuxi Sensor gives you a resource view of the MaxFrame job at the Fuxi instance level. Use it to diagnose out-of-memory (OOM) errors and analyze performance bottlenecks.
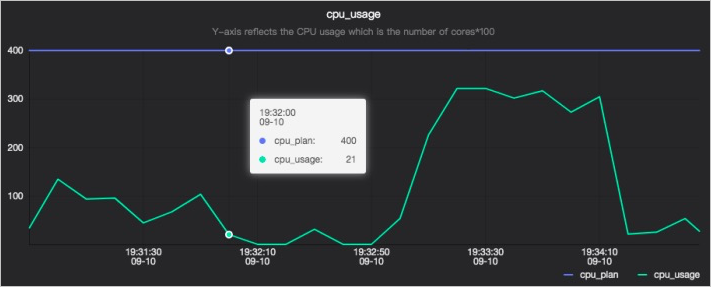
CPU utilization
The CPU utilization chart plots two lines: cpu_plan (CPUs requested) and cpu_usage (CPUs actually used). On the y-axis, 400 represents four processors.
Use this chart to check whether your job is underusing or saturating its CPU allocation. To increase CPU resources, raise the number of processors — you cannot directly set CPU utilization.
Memory usage
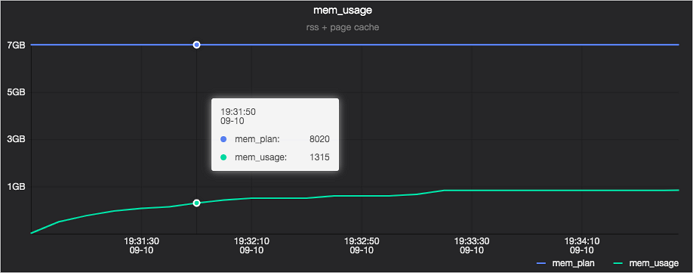
The memory usage chart plots two lines: mem_plan (memory requested) and mem_usage (memory actually used).
Use cases
View the longest-running items
View the Timeline column in the DAG List, sub DAG list, or instance list to spot which item took the longest at each level.

If the list spans multiple pages, sort by the Duration column in descending order to bring the slowest items to the top without paging through results.
View the cause of an error
If a DAG fails or the client returns an exception, trace the error from the DAG level down to the instance level:
-
In the DAG List, find the most recent entry with Status = Failed.
-
Click
 in its Detail column.
-
On the DAG details page, locate the sub DAG node highlighted in red (for example,
STAGE_1). Alternatively, check the Result tab for the error message.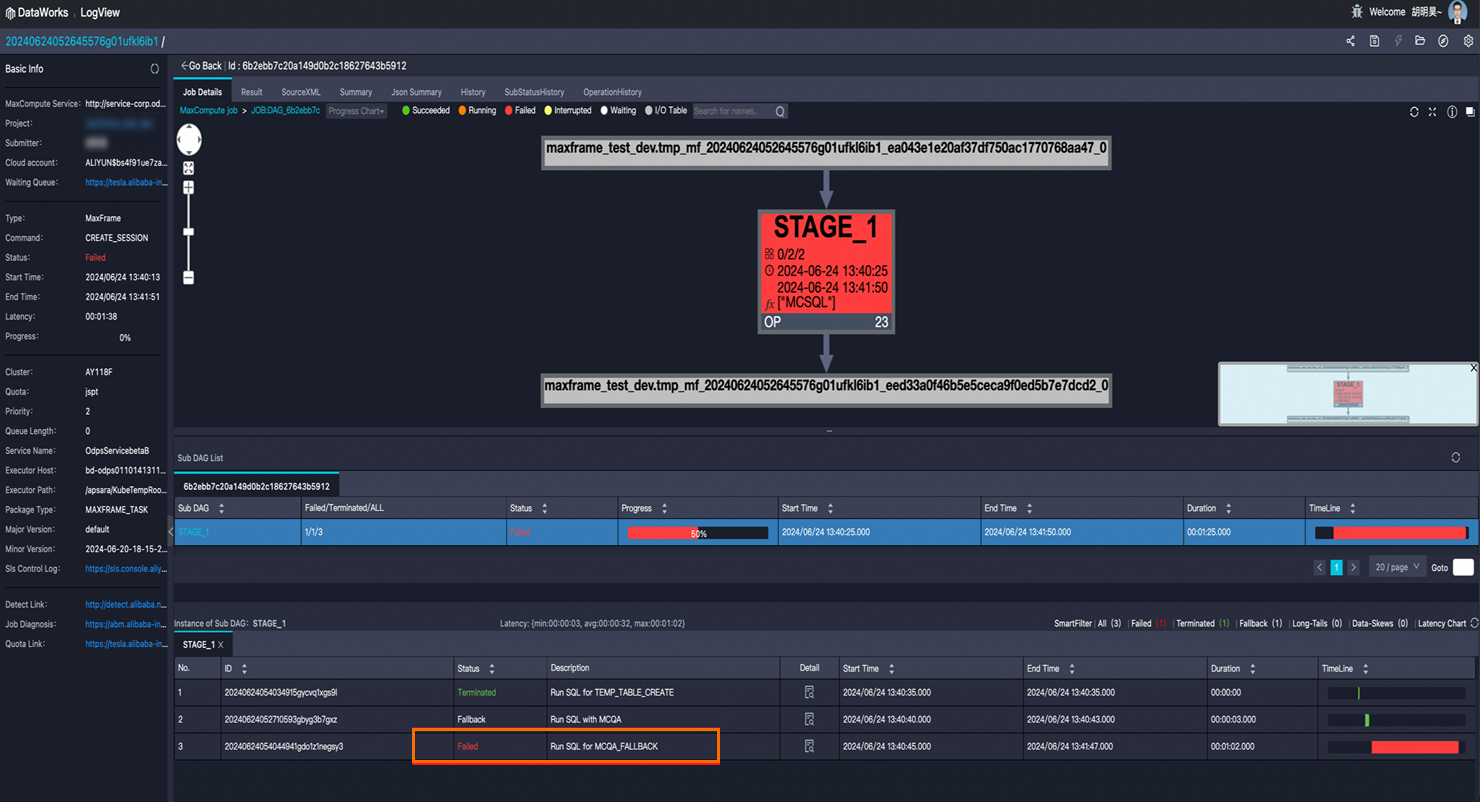

-
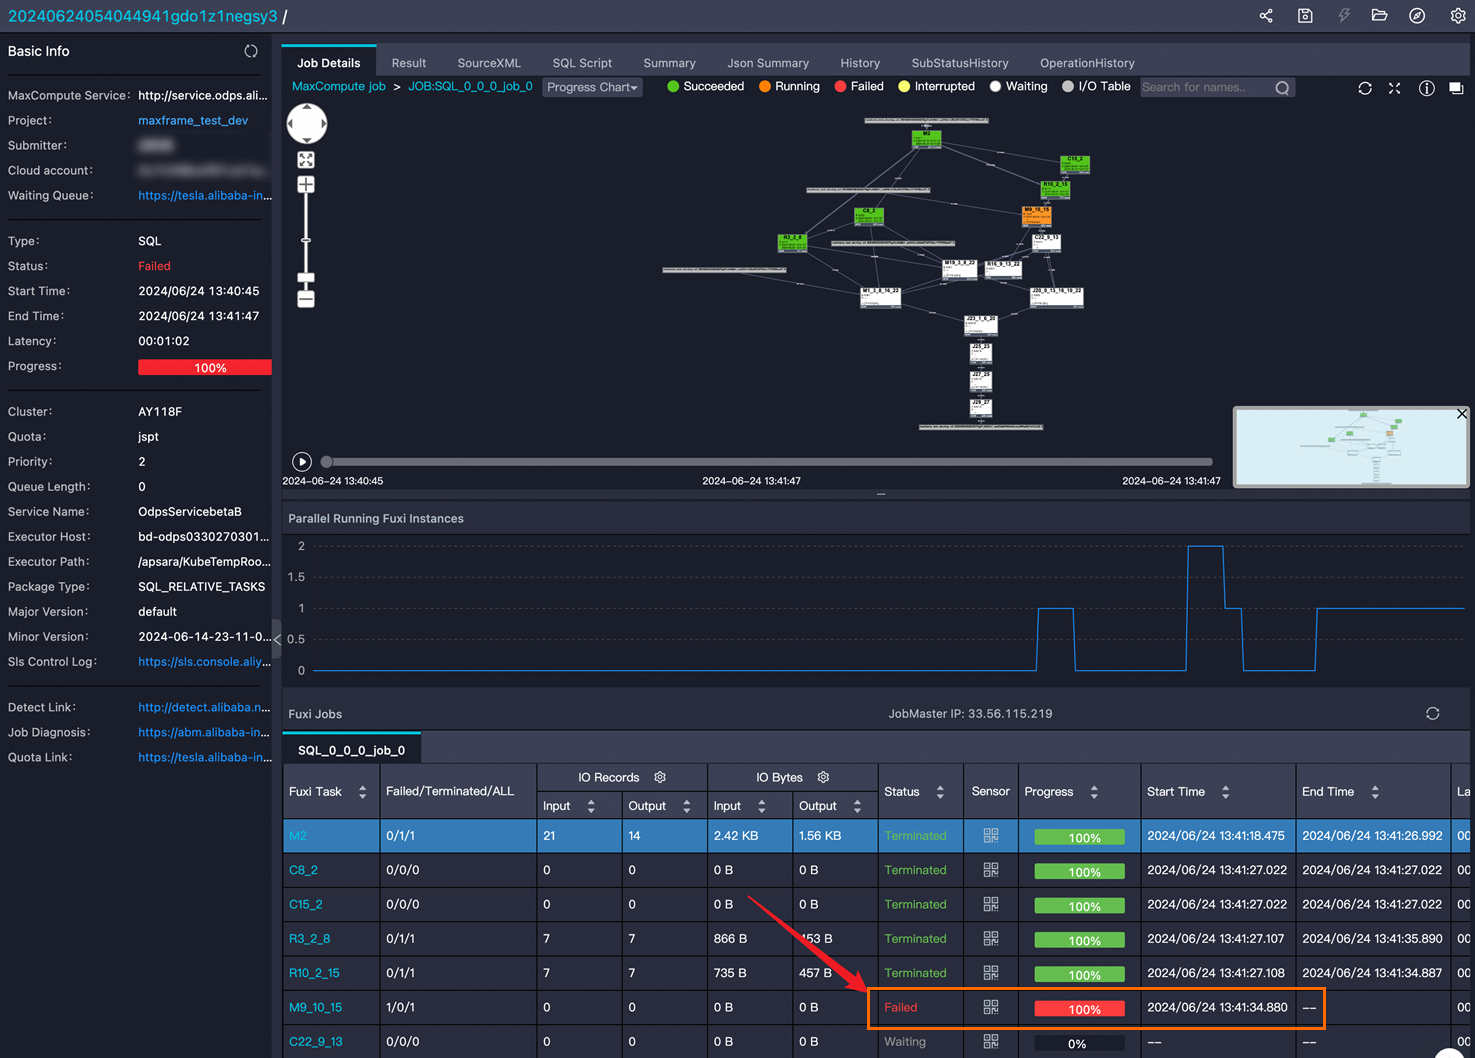
Click the failed sub DAG node (
STAGE_1), then click in the Instance list's Detail column to find the failed instance.
View operators in a sub DAG
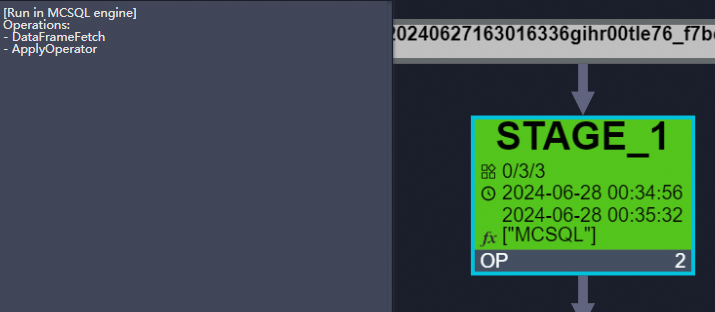
On the DAG details page, use either method to open the operator graph:
-
Method 1: Click the desired sub DAG node.
-
Method 2: Double-click the desired sub DAG node.
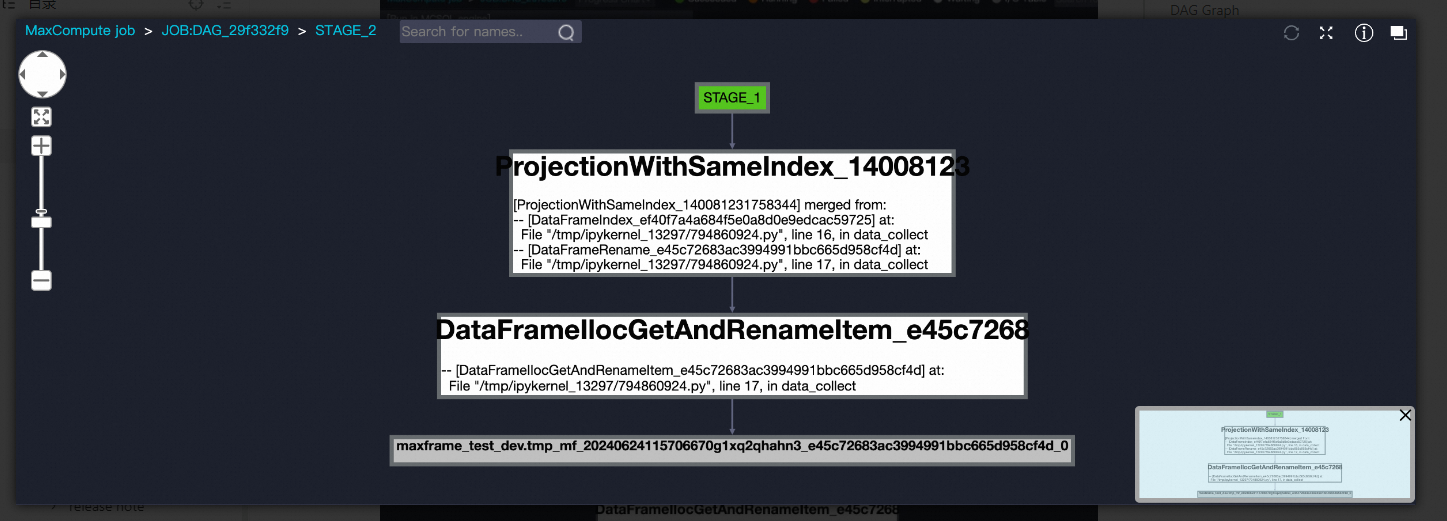
Each operator is annotated with the line in your MaxFrame script that generated it, so you can trace operator graph elements directly back to your code.
Operators labeled merged from were combined by the optimizer after the DAG was submitted. They have the same behavior as the originals but with better performance.
View data flow structure
To inspect the data flowing between operators, double-click a sub DAG node to open the operator details page, then click the connection line between two operators.
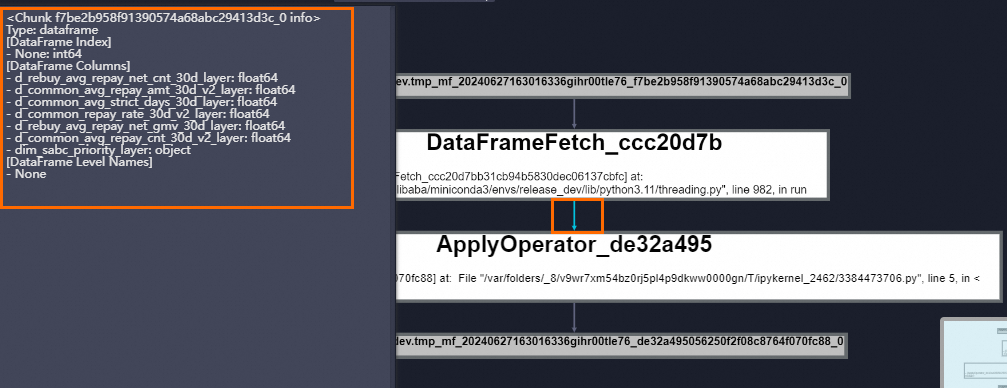
The panel shows:
| Field | Description |
|---|---|
| Type | Output type of the upstream operator. dataframe means the operator outputs a DataFrame. |
| DataFrame Index | Index definition. None: int64 means an unnamed index of type int64. |
| DataFrame Columns | All columns and their types: <column name>: <dtype>. |
| DataFrame Level Names | Name of the DataFrame level. |
View the structure of a data table
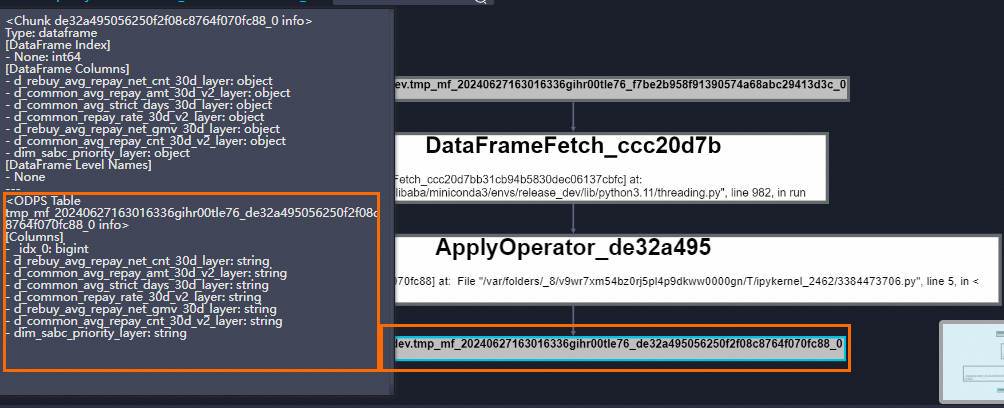
Click a MaxCompute table node in an operator graph or sub DAG graph to view its schema.
View job details
On the DAG details page, click ![]() in the Instance list's Detail column to view full details for that instance.
in the Instance list's Detail column to view full details for that instance.