The Spark UI is an important tool for diagnosing open source Spark jobs. This topic describes how to use the Spark UI to diagnose jobs.
Diagnose jobs using the Spark UI
Step 1: Get the link
After you open the MaxCompute Spark LogView URL, you can obtain the Spark UI link. The Spark UI is an important tool for diagnosing open source Spark jobs. You can use it to obtain job logs and verify that a job was submitted and executed correctly.
In the summary module of the MaxCompute Spark LogView URL, find the Spark UI link and the History Server link, as shown in the following figure:
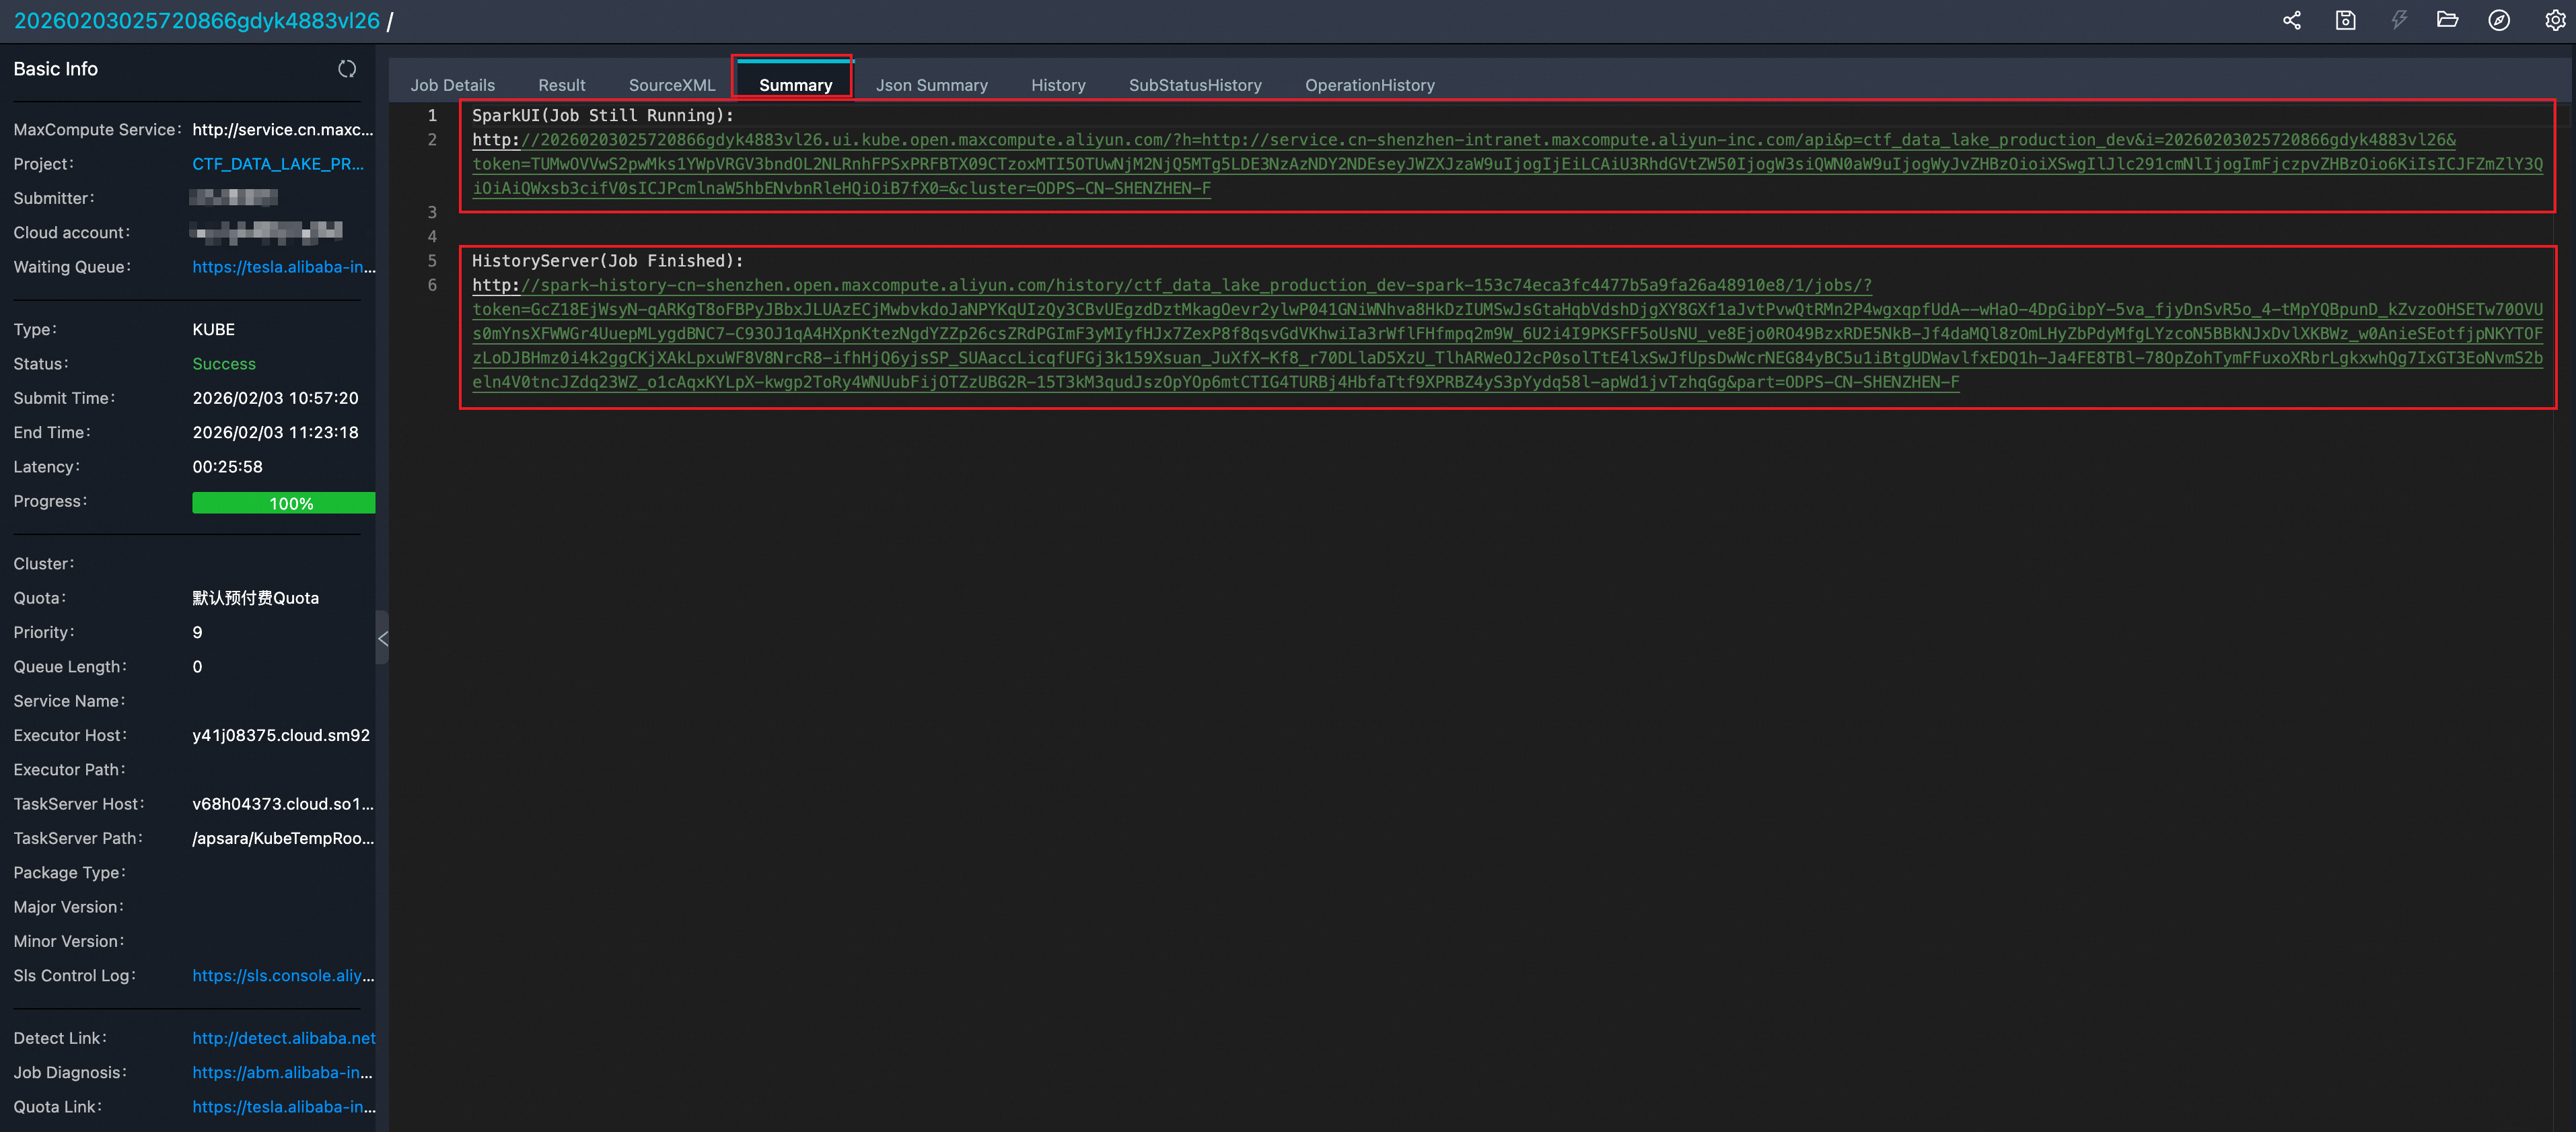
Spark Web UI: This link is accessible only while a job is running. It contains information such as the current job progress and thread stacks.
Spark History Server: This link is accessible after a job is complete. There is a 1 to 3 minute delay for events to be sent from the driver to the History Server. If you open the Tracking URL immediately, a page might appear with the
Application application_1560240626712_2078769635 not found.error. Wait a moment and try to access it again.To view the History Server in kube mode, modify the eventLog parameters in the
spark-defaults.confconfiguration file as follows:(Required) spark.eventLog.enabled = true (Required) spark.eventLog.dir = /workdir/eventlog/ (Optional) spark.eventLog.compress = true (Optional) spark.eventLog.overwrite = true
Step 2: View basic job information using the Spark UI
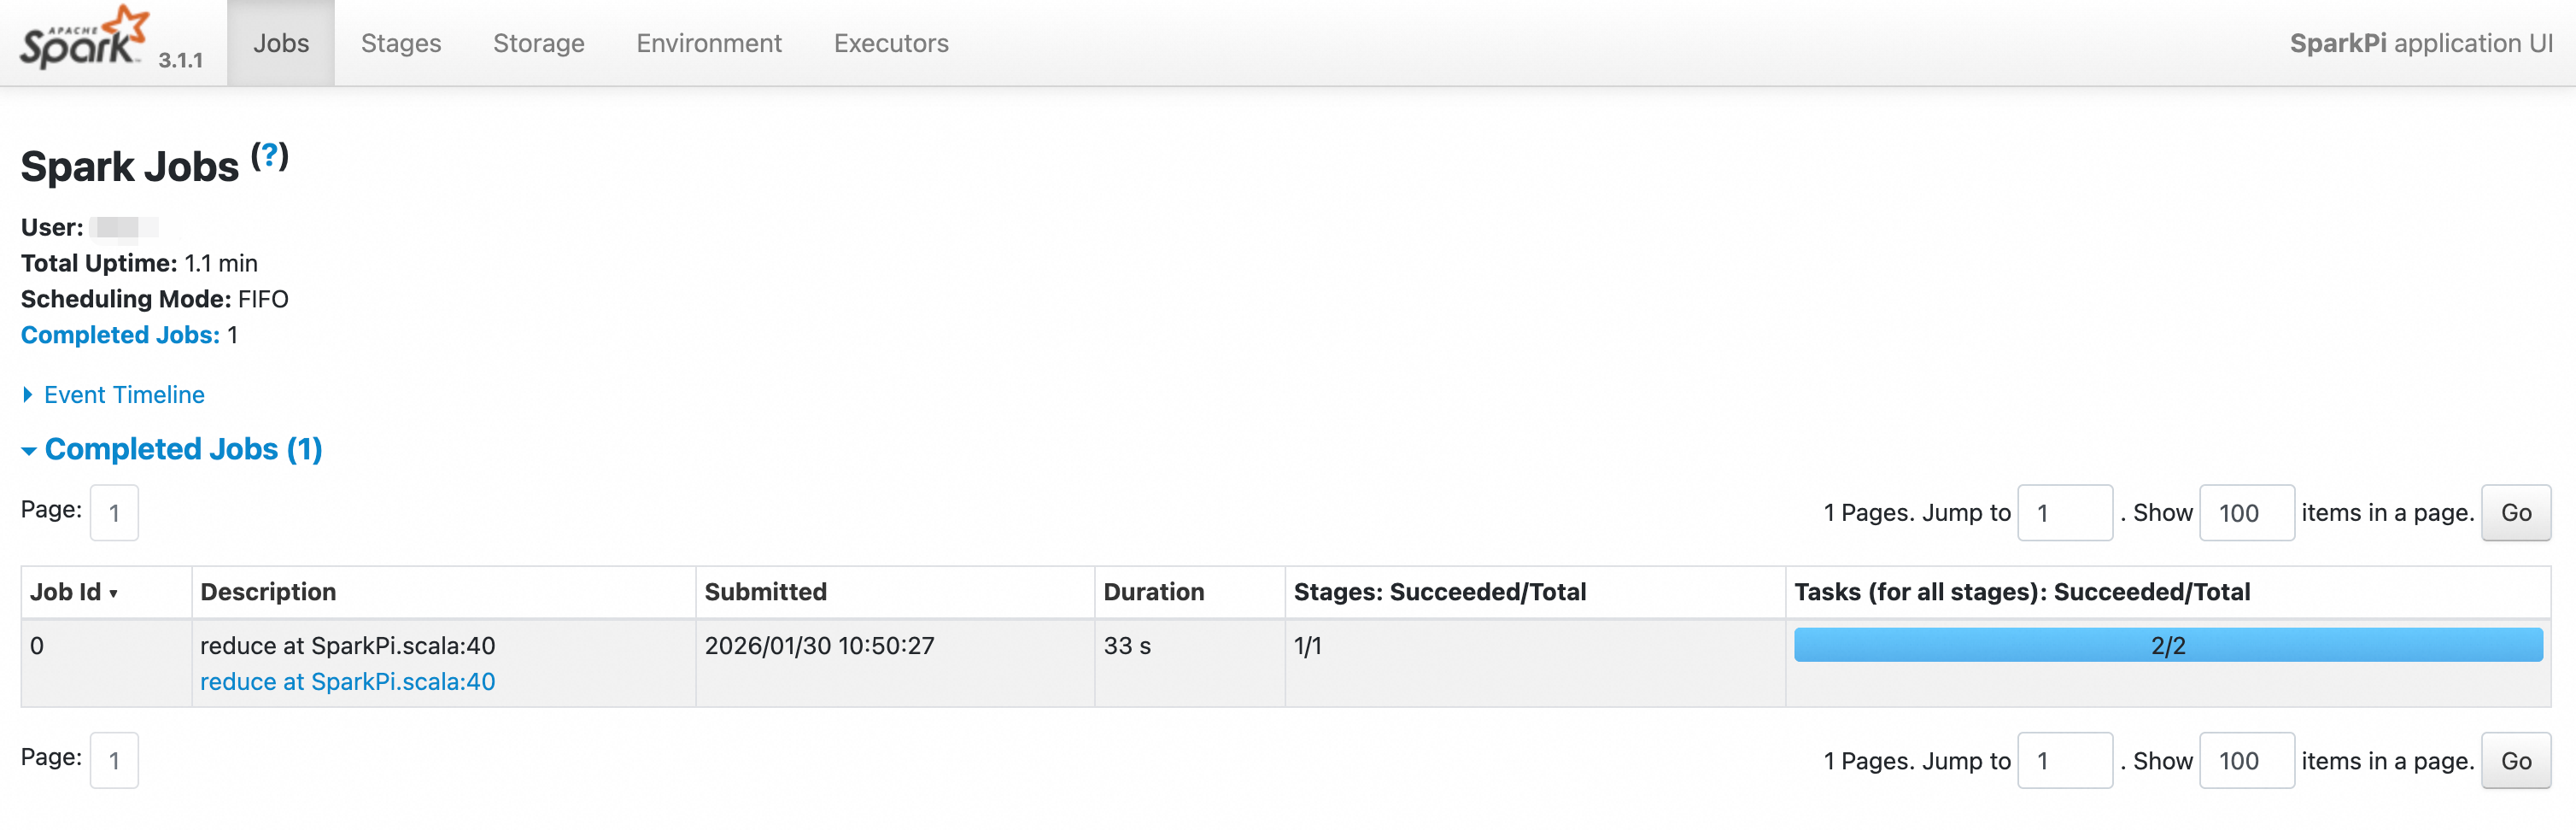
Copy the link and paste it into a browser. The Spark Web UI appears, as shown in the following figure:
Click the
Environmenttab to confirm the configured Spark parameters.On the
Environmenttab, check the configured parameters to verify that all settings have taken effect. This issue usually occurs becauseSPARK_HOMEis not set, which prevents thespark-defaults.confconfiguration file from being read correctly.Click the
Executorstab. Pay close attention to anyDeadnodes and theThread Dump.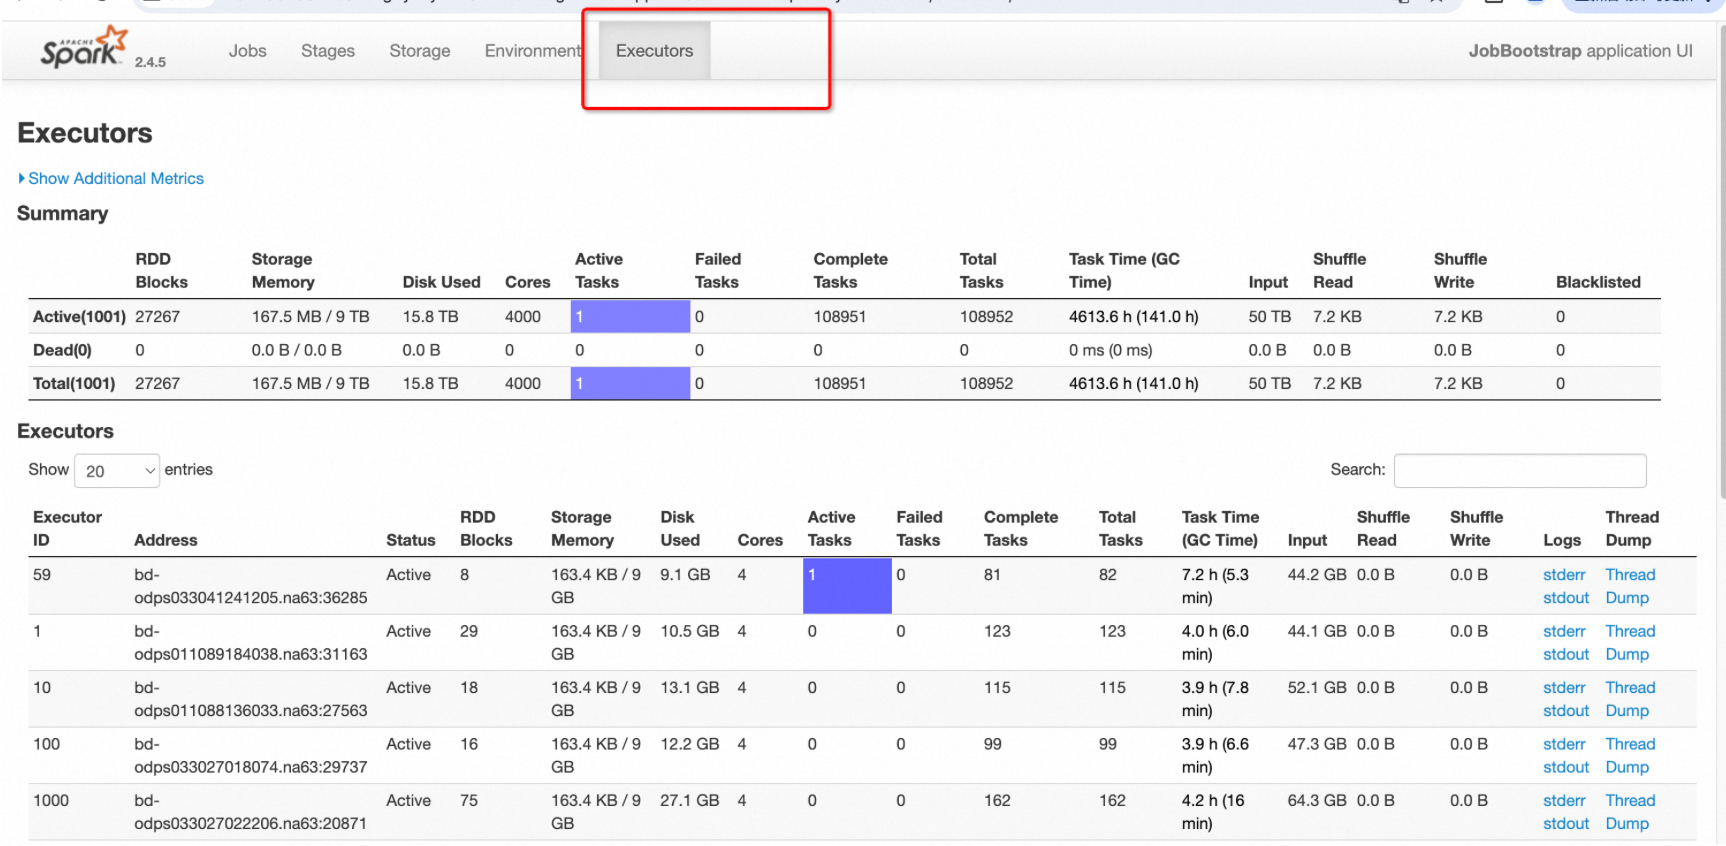
Click the Logs-StdOut button to view the node's result output.
Click the Logs-StdErr button to view the node's
log4jlog.
Step 3: Use the Spark UI to troubleshoot blocked or slow jobs
The Spark UI lets you view running tasks and their statuses. On the Executors tab, you can use the thread dump button for each executor to view its thread stack snapshot.
Open the Spark UI for the running job and switch to the Executors tab.

Determine if the driver thread or an executor thread is stuck.
In the figure, Executor 59 has one active task. This means one task is not yet complete. Click the Thread Dump button for that executor to view its thread stack information.
If the number of active tasks is 0 for all executors, all executors are idle. The current job is likely stuck in the driver's execution logic. Click the Thread Dump button for the driver to view its thread stack information.
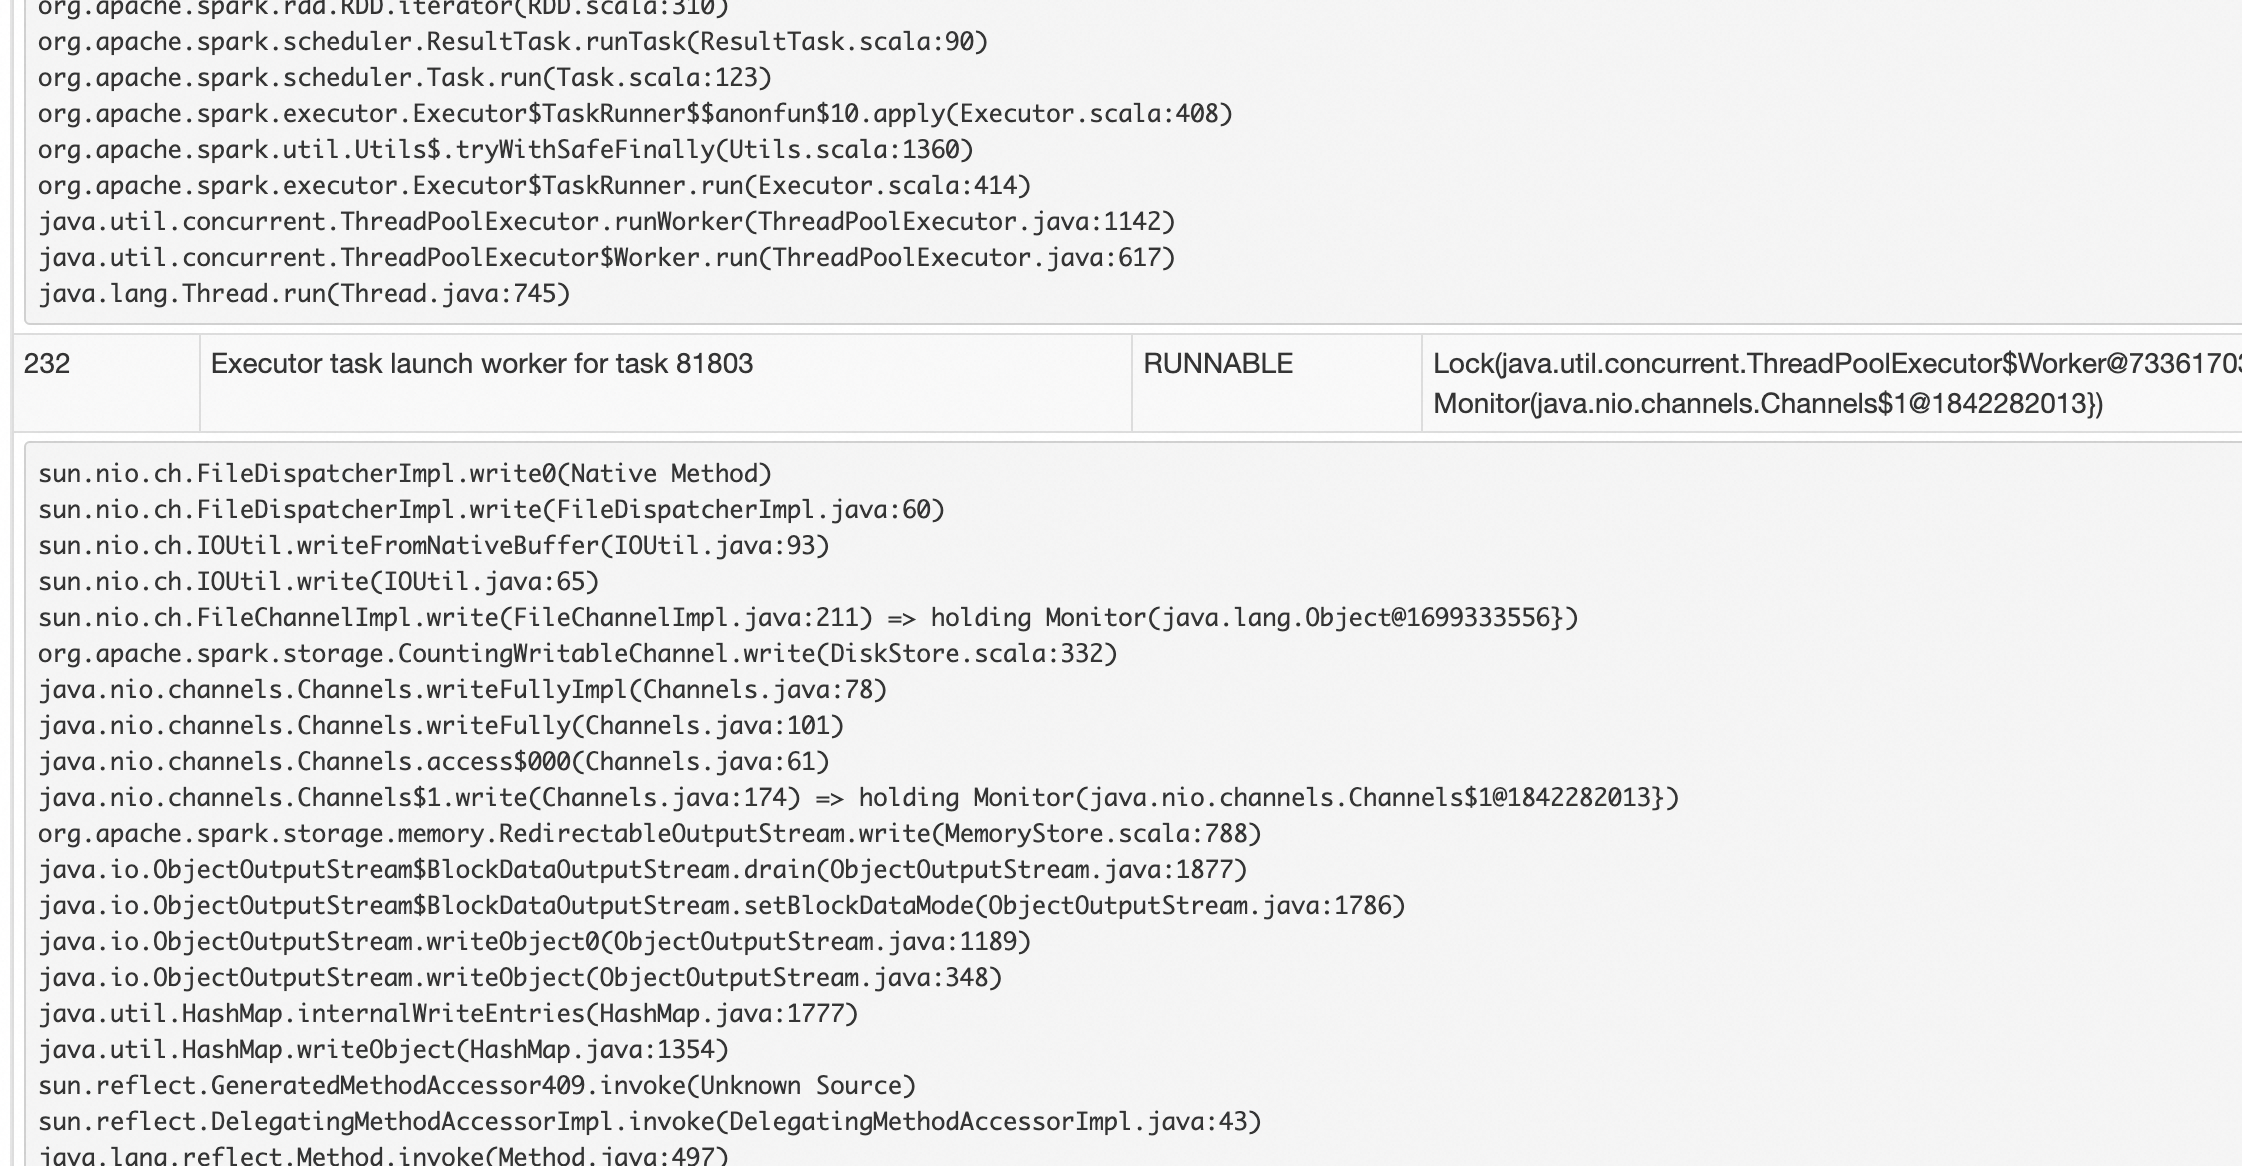
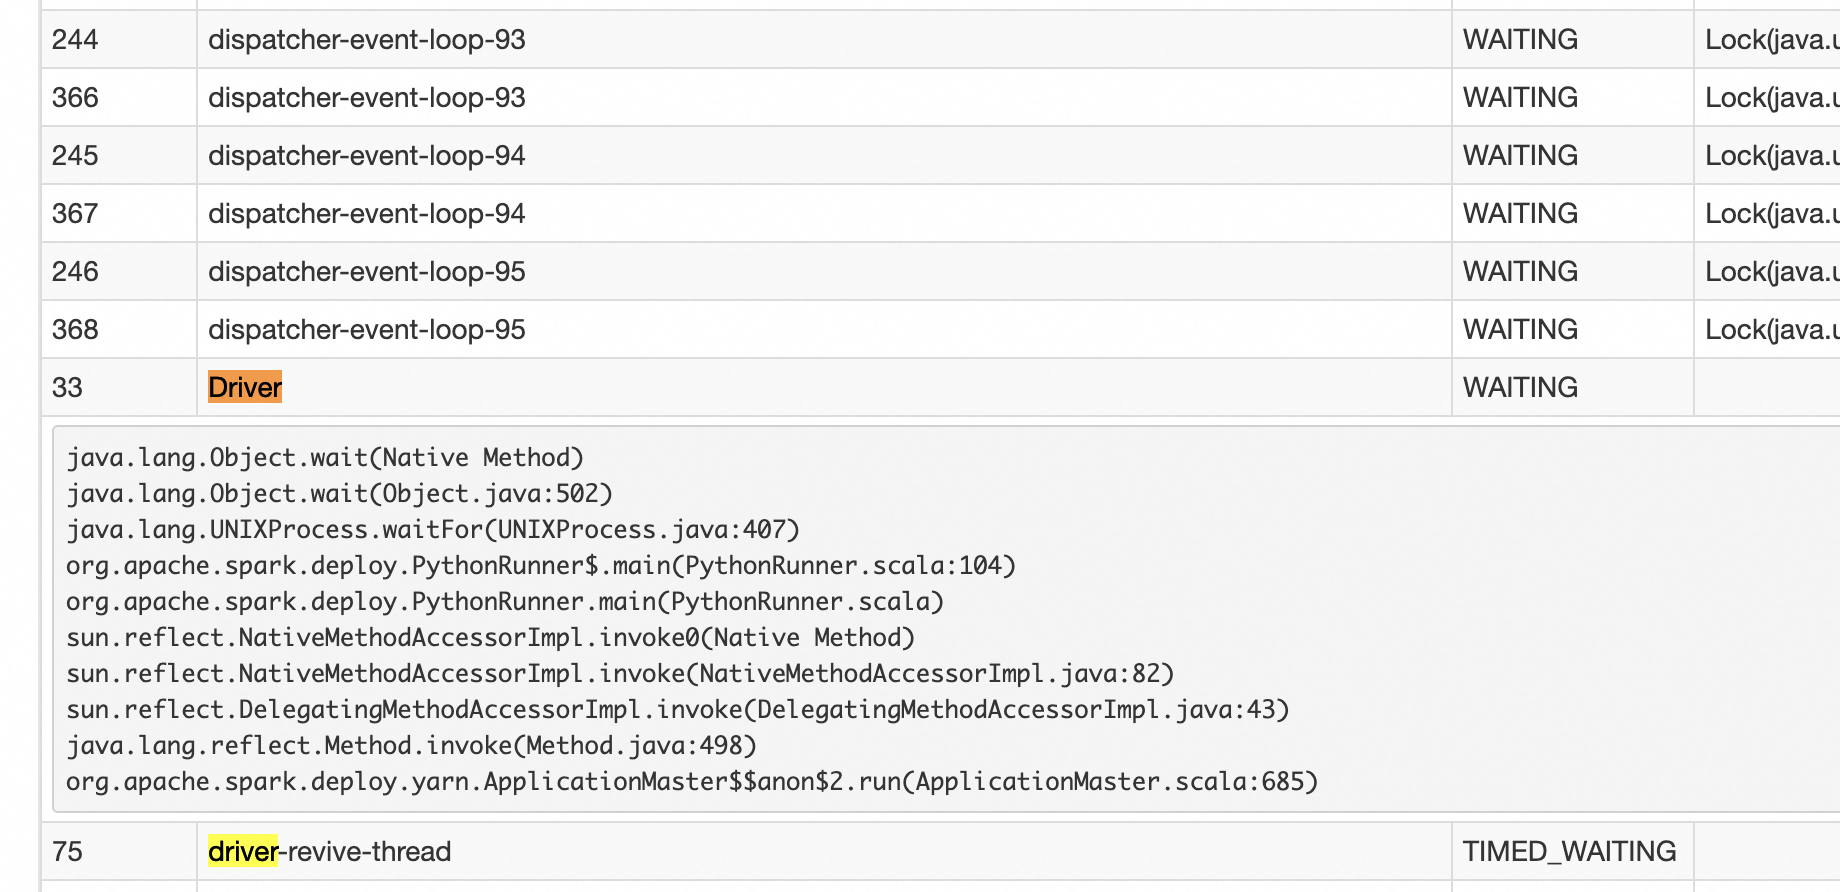
The driver's main thread typically looks like this:
An executor's execution thread typically looks like this: