Logview is a browser-based tool for MaxCompute jobs that you can use to view and debug jobs after submitting them. Open its Logview URL to check the job status, inspect task results, and diagnose failures.
Each Logview URL expires seven days after the job is submitted. Save the URL or export any results you need before it expires.
How Logview works
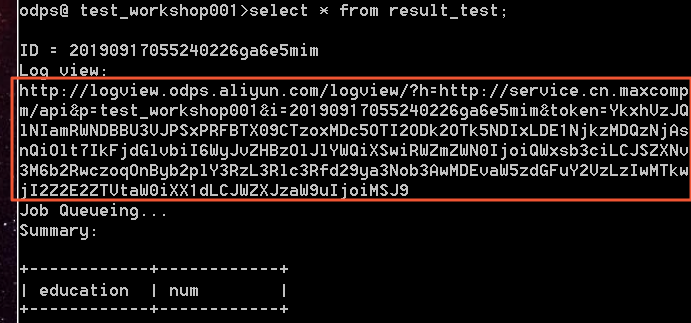
When MaxCompute receives a job, it generates a unique Logview URL. Paste the URL into a browser and press Enter to open the job's Logview page.
The Logview page has two sections:
-
ODPS Instance — shows instance-level details for the submitted job, including its queue position and current status.
-
ODPS Tasks — shows the individual tasks that make up the job, along with their results and execution details.
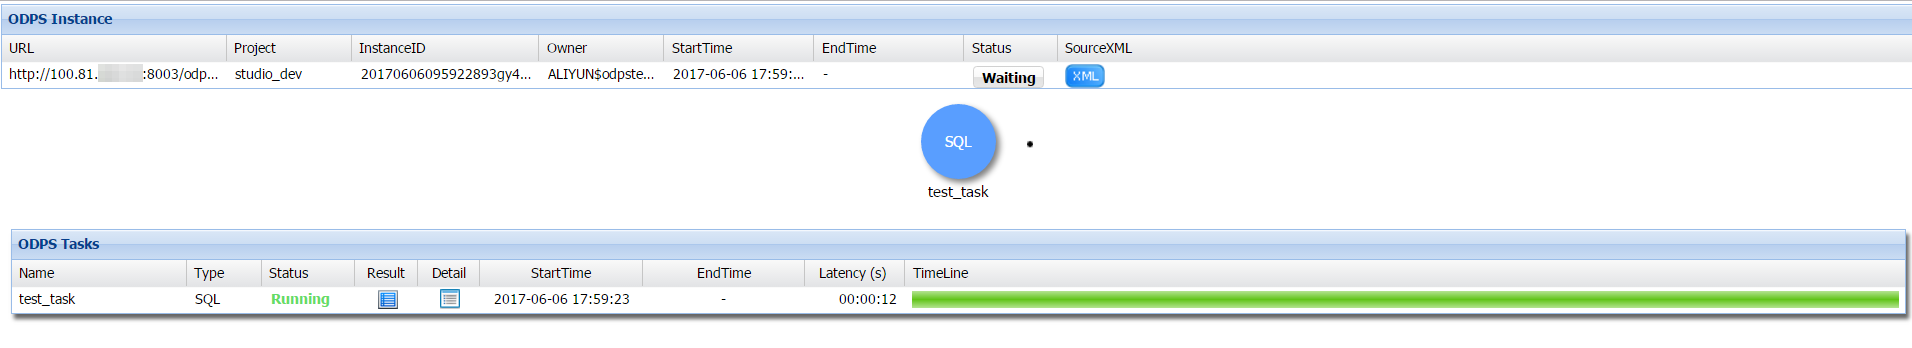
ODPS Instance section
The ODPS Instance section displays the following fields:
| Field | Description |
|---|---|
| URL | The Logview URL for this instance |
| Project | The MaxCompute project the job belongs to |
| InstanceID | The unique identifier for this instance |
| Owner | The account that submitted the job |
| StartTime | When the job started |
| EndTime | When the job ended |
| Status | The current status of the job |
Job status values
Click the Status value to view queue details. The table below describes each status and what action to take.
| Status | Meaning | What to do |
|---|---|---|
| Waiting | The job is being processed by MaxCompute and has not yet reached Job Scheduler. | No action needed. The job advances automatically. |
| Waiting List: *n* | The job is queued in Job Scheduler. *n* is the position in the queue. | Monitor the queue position. A persistently high position may indicate resource contention — consider adjusting job priority or scheduling off-peak. |
| Running | The job is running in Job Scheduler. | No action needed. |
| Terminated | The job is terminated. No queue information is available. | Check the Result and StdErr columns in the ODPS Tasks section to determine whether the job succeeded or failed. |
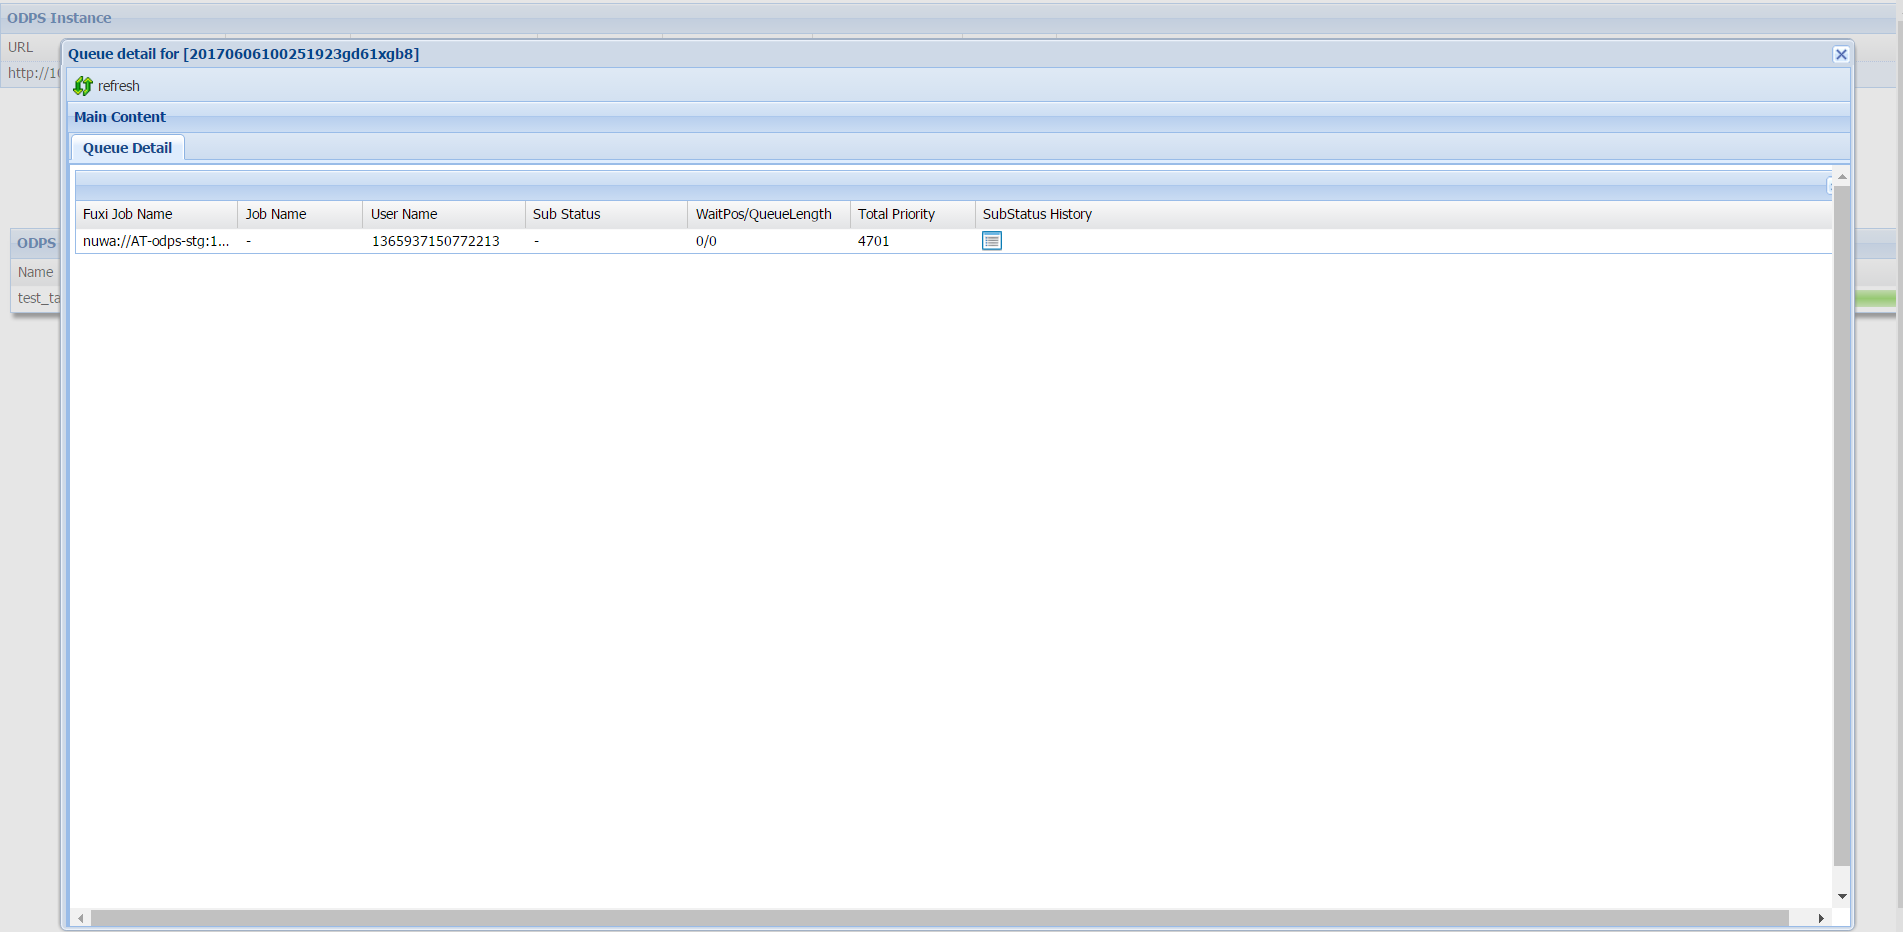
Queue details
When you click a Status value other than Terminated, the following queue fields appear:
| Field | Description |
|---|---|
| Sub Status | The current sub-status of the job |
| WaitPos | Position in the queue. 0 means the job is running; - means the job has not yet reached Job Scheduler. |
| QueueLength | Total number of jobs in the Job Scheduler queue |
| Total Priority | The execution priority assigned by the system |
| SubStatus History | Click the icon to view the full status history, including status codes, descriptions, start times, and durations. Unavailable in some versions. |
ODPS Tasks section
The ODPS Tasks section lists all tasks associated with the instance. Each row represents one task and includes the following columns:
| Column | Description |
|---|---|
| Name | The task name |
| Type | The task type |
| Status | The current status of the task |
| Result | Click the icon to view task results (available after the task completes) |
| Detail | Click the icon to view execution details (available for both running and completed tasks) |
| StartTime | When the task started |
| EndTime | When the task ended |
| Latency (s) | Total running duration in seconds |
| TimeLine | A visual timeline of the task |
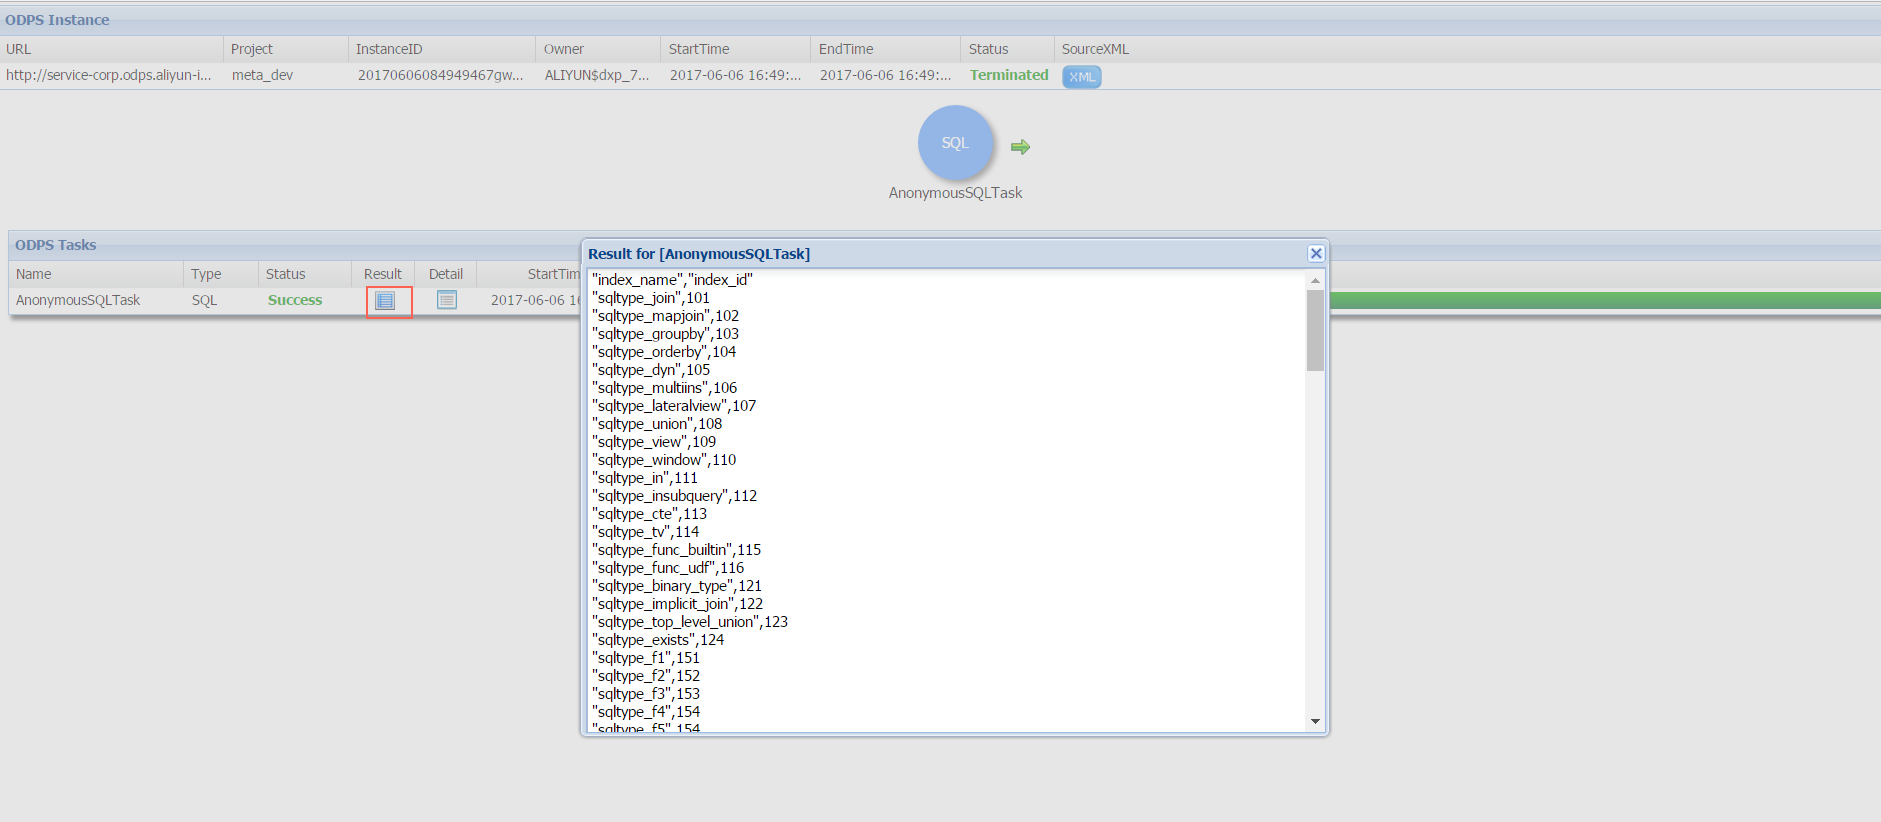
View task results
After a task completes, click the icon in the Result column to see the output. For SELECT statements, the result set appears in a table.
View execution details
Click the icon in the Detail column to open the task details dialog. This dialog shows the internal job hierarchy that MaxCompute uses to execute the task.
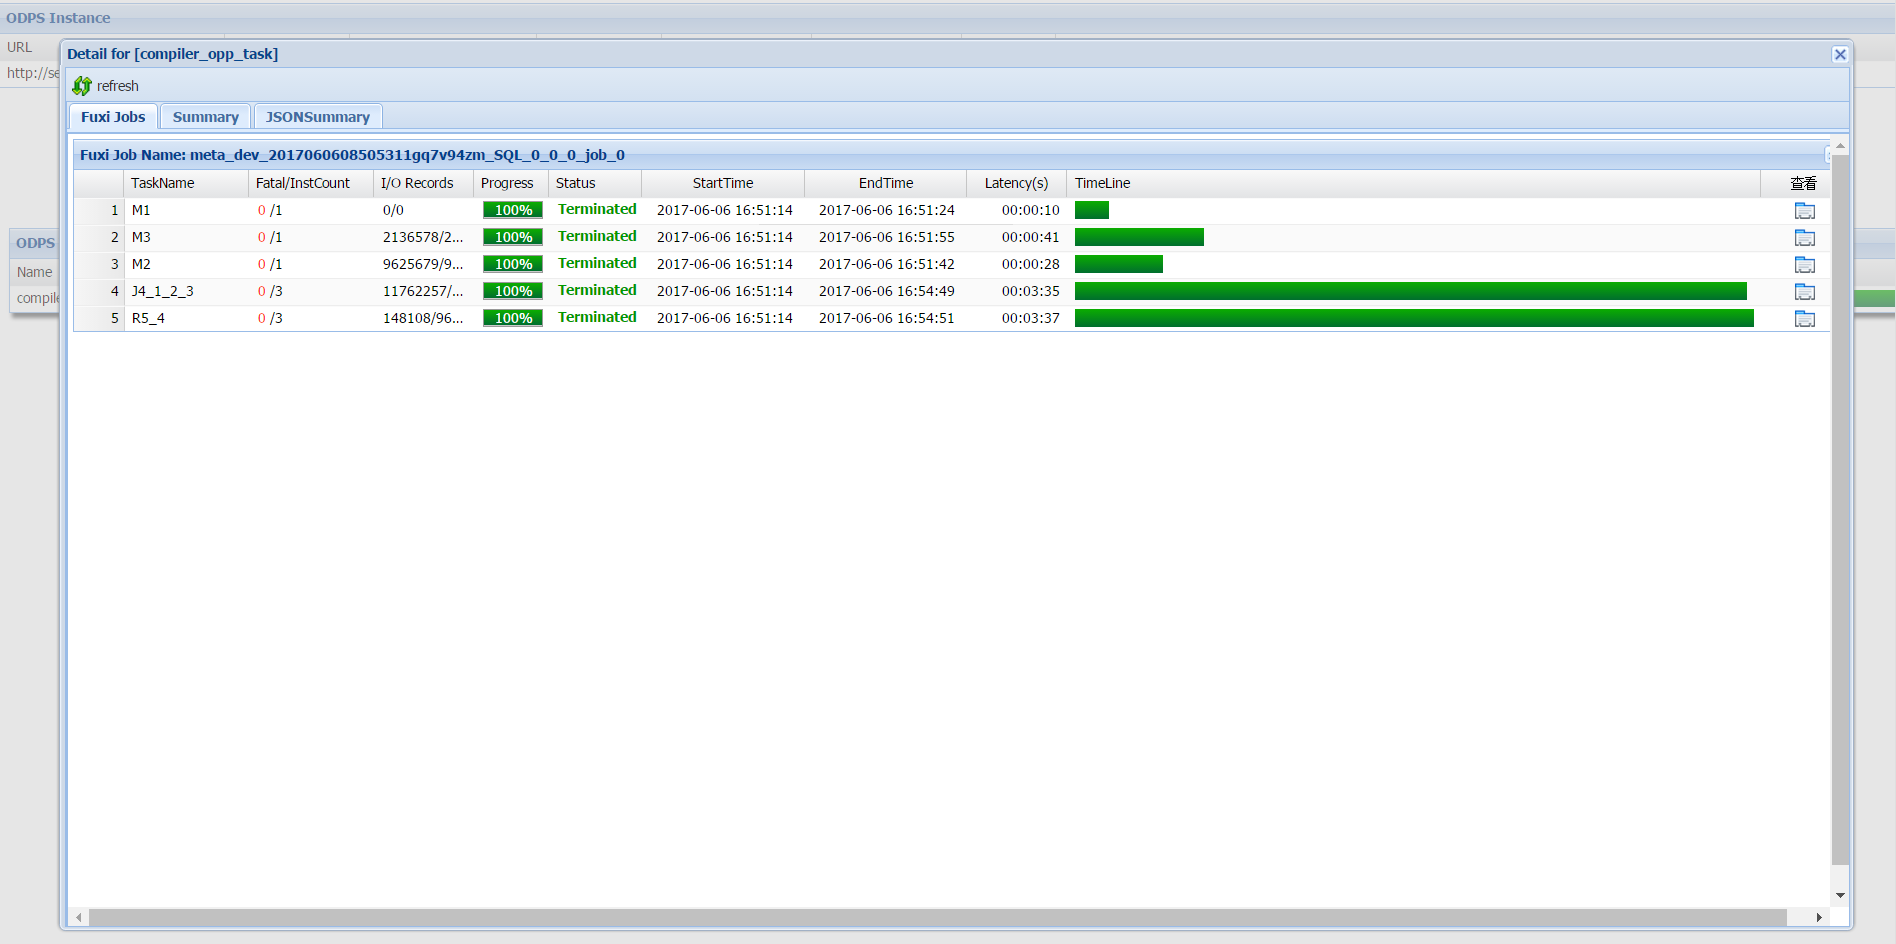
Job hierarchy
MaxCompute breaks a job down into the following layers:
-
A MaxCompute job consists of one or more Fuxi jobs. A complex SQL job may generate multiple Fuxi jobs, each submitted to Job Scheduler.
-
Each Fuxi job consists of one or more Fuxi tasks. A simple MapReduce job generates two Fuxi tasks: a map task (M1) and a reduce task (R2). Complex SQL jobs may produce more.
-
Each Fuxi task consists of one or more Fuxi instances — one instance per node. As input data grows, MaxCompute starts additional nodes to parallelize the work.
Fuxi task naming
Fuxi task names encode both the task type and its dependencies:
-
The leading letter identifies the task type:
Mfor map,Rfor reduce,Jfor join. -
The digits that follow encode the task ID and its dependencies. For example:
-
R5_4— this reduce task runs only after task J4 completes. -
J4_1_2_3— this join task runs only after tasks M1, M2, and M3 complete.
-
The I/O Records column shows the number of input and output records for each Fuxi task.
Fuxi instance details
To inspect an individual Fuxi instance, click the icon in the Show Detail column or double-click the Fuxi task row.
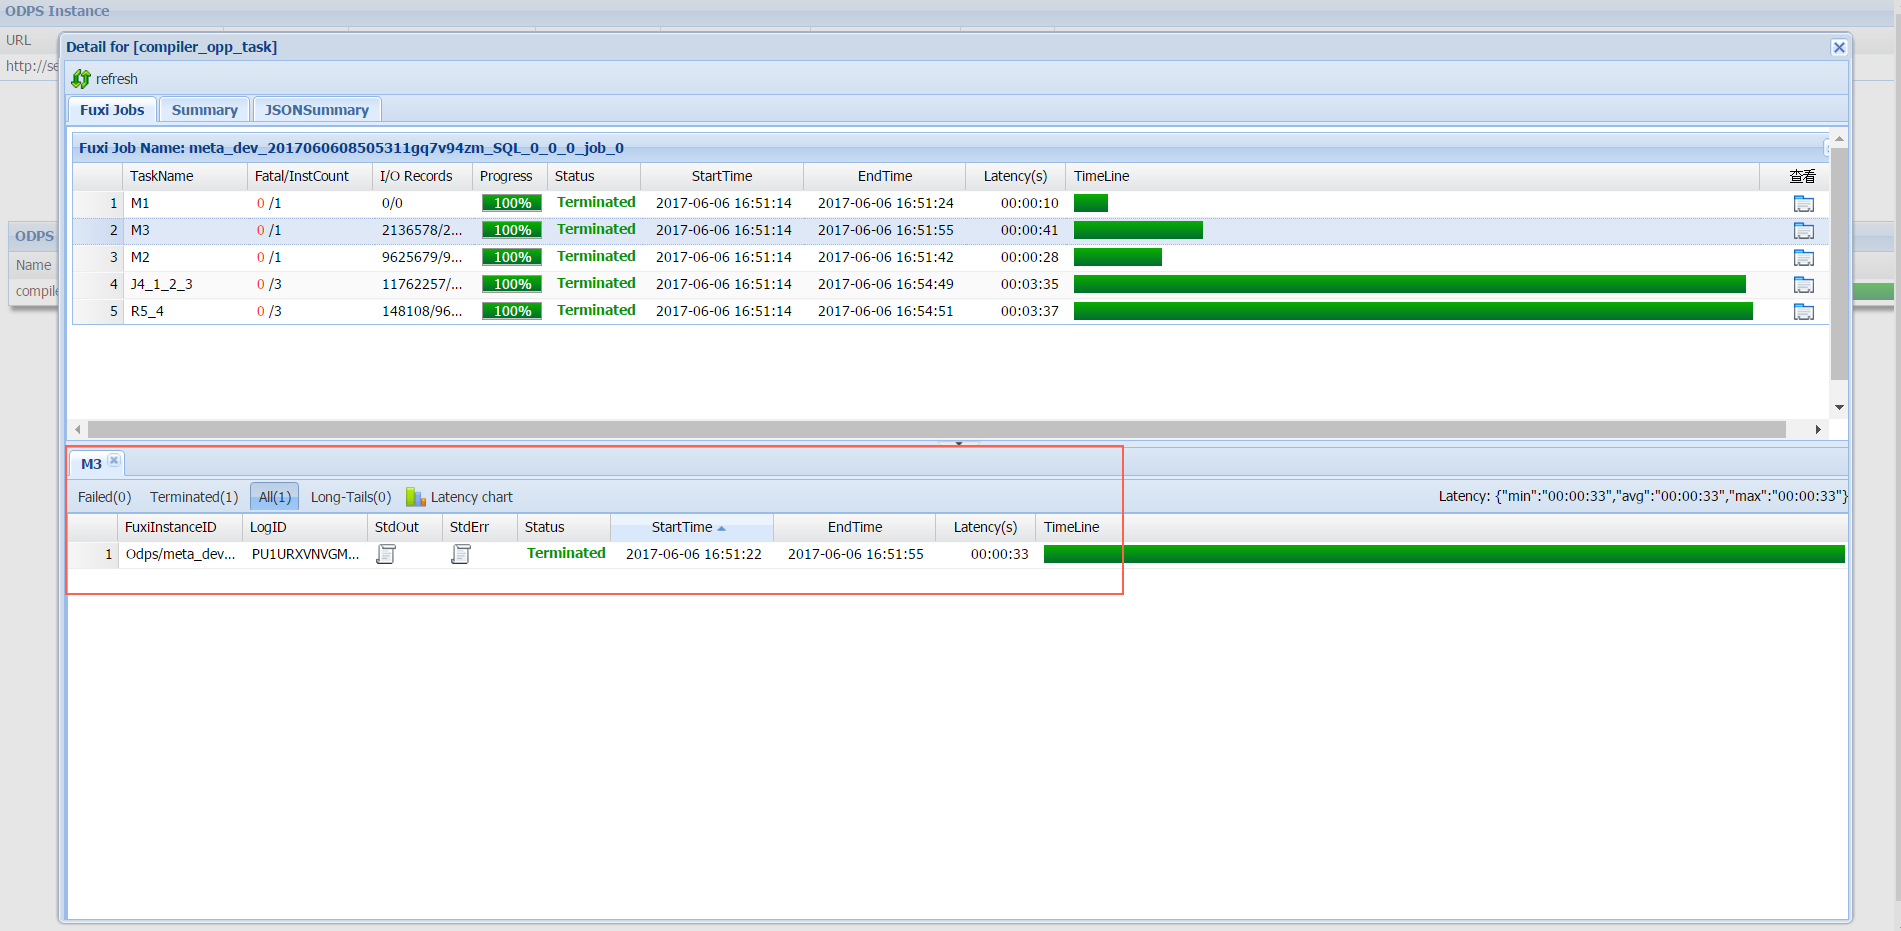
The lower part of the dialog groups Fuxi instances by stage. Click the Failed tab to see nodes where errors occurred. Use the StdOut and StdErr columns to view standard output and error output for each instance. Output written explicitly in the submitted job also appears here.
Troubleshooting
Tasks with errors
If a task fails:
-
In the ODPS Tasks section, find the failed task.
-
Click the icon in the Result column to view the error message.
-
Alternatively, open the Detail dialog, click the Failed tab, and click the icon in the StdErr column of the failing Fuxi instance for more detail.
Data skew
Data skew occurs when records are unevenly distributed across Fuxi instances — some instances process far more data than others, slowing the entire task.
To check for data skew after a task completes:
-
Open the Detail dialog for the task.
-
Click the Summary tab.
-
Review the output record distribution. Example:
output records:
R2_1_Stg1: 199998999  (min: 22552459, max: 177446540, avg: 99999499)
If the max value is significantly larger than the min value, data skew is present. In the example above, the instance with the most records processed roughly 8x the records of the instance with the fewest. A common cause is a JOIN on a column where one value appears far more often than others.