PyODPS DataFrame wraps the Matplotlib plotting API so you can generate charts directly from MaxCompute data inside a Jupyter notebook—without manually converting to a local pandas DataFrame first.
Prerequisites
Before you begin, ensure that you have:
pandas and Matplotlib installed. Run
pip install matplotlibto install Matplotlib and pandas.A Jupyter notebook connected to MaxCompute.
Quick start
The following example loads the pyodps_iris table and plots a single column as a line chart.
from odps.df import DataFrame

iris = DataFrame(o.get_table('pyodps_iris'))
%matplotlib inline

iris.sepalwidth.plot()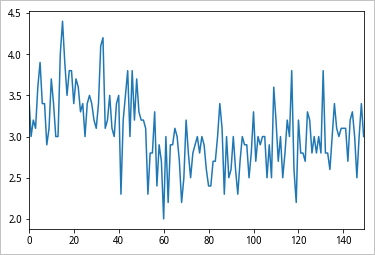
Plot examples
All examples use the iris DataFrame created in the quick start above.
Multi-line plot
Call plot() on the full DataFrame to plot all numeric columns as separate lines.
iris.plot()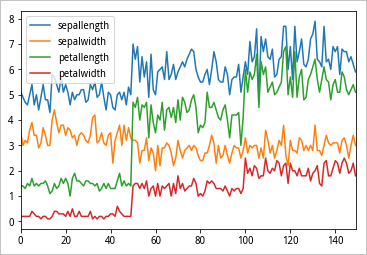
Vertical bar plot
Use kind='bar' to produce a vertical bar plot. The example below groups by species, sums each group, and stacks the bars with a 30-degree label rotation.
iris.groupby('name').sum().plot(kind='bar', x='name', stacked=True, rot=30)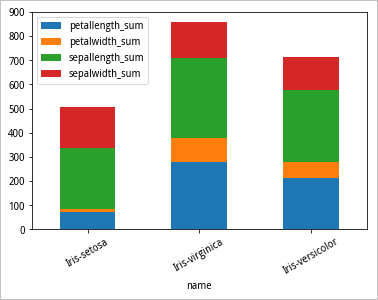
Histogram
Call hist() to generate a histogram grid with a shared x-axis.
iris.hist(sharex=True)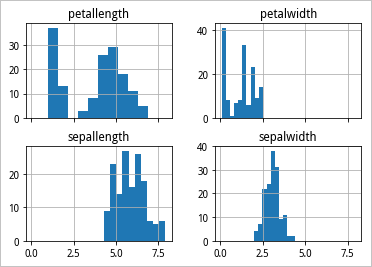
Supported chart types
Pass the kind parameter to plot() to select a chart type. For the full parameter reference, see pandas.DataFrame.plot.
kind value | Chart type |
|---|---|
line | Line plot |
bar | Vertical bar plot |
barh | Horizontal bar plot |
hist | Histogram |
box | Box plot |
kde | Kernel density estimation plot |
density | Kernel density estimation plot |
area | Area plot |
pie | The pie plot |
scatter | Scatter plot |
hexbin | Hexagonal bin plot |
plot() parameters
The plot() function supports the following parameters for axis and title customization.
| Parameter | Type | Description |
|---|---|---|
xlabel | string | Label text for the x-axis |
ylabel | string | Label text for the y-axis |
xlabelsize | int | Font size of the x-axis label |
ylabelsize | int | Font size of the y-axis label |
labelsize | int | Font size applied to both axis labels |
title | string | Chart title text |
titlesize | int | Font size of the chart title |
annotate | bool | Specifies whether to add an annotation |