Three debugging tools are available, ordered from lightweight to more involved:
-
Visualize the execution plan — see how PyODPS optimizes and merges your operations before execution
-
Inspect compiled SQL — verify the SQL that PyODPS generates for the MaxCompute SQL backend
-
Run locally with pandas — download a small sample and iterate quickly without scheduling a MaxCompute job
Visualize the execution plan
Visualizing the execution plan before you run a computation helps you identify where operations are merged into a single stage and where explicit stage boundaries exist. This reveals potential bottlenecks — such as operations that cannot be parallelized — before they affect production jobs.
Prerequisites: Install graphviz and the graphviz Python package.
Call .visualize() on any DataFrame to render its computation graph.
Example: operations merged into a single stage
When no cache boundary separates operations, PyODPS combines them automatically:
>>> df = iris.groupby('name').agg(id=iris.sepalwidth.sum())
>>> df = df[df.name, df.id + 3]
>>> df.visualize()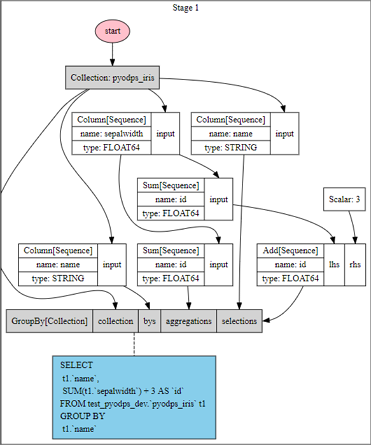
The graph shows that PyODPS merges the groupby and column filtering operations into a single stage.
Example: operations split across two stages
Inserting .cache() between operations forces a stage boundary:
>>> df = iris.groupby('name').agg(id=iris.sepalwidth.sum()).cache()
>>> df2 = df[df.name, df.id + 3]
>>> df2.visualize()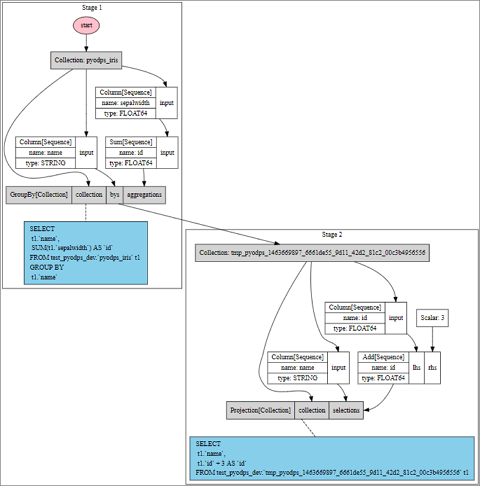
The graph now shows two stages because the .cache() call creates an explicit execution boundary. Comparing these two graphs makes it clear where stage splits occur and where merging is possible.
Inspect compiled SQL
Call .compile() to see the SQL that PyODPS generates for the MaxCompute SQL backend. Use this to verify that the generated query matches your intent before submitting a job.
>>> df = iris.groupby('name').agg(sepalwidth=iris.sepalwidth.max())
>>> df.compile()
Stage 1:

SQL compiled:

SELECT
  t1.`name`,
  MAX(t1.`sepalwidth`) AS `sepalwidth`
FROM test_pyodps_dev.`pyodps_iris` t1
GROUP BY
  t1.`name`
Run locally with pandas
For faster iteration, download a small data sample from MaxCompute and run it against the pandas computation backend. Because PyODPS uses the MaxCompute Tunnel service to download data directly, this bypasses the MaxCompute SQL backend scheduler entirely — no job scheduling wait.
The following operations trigger a Tunnel download instead of a MaxCompute SQL job:
Non-partitioned table: select all or some rows, filter columns, or count rows. Column filtering does not compute column values.
>>> iris.count()
>>> iris['name', 'sepalwidth'][:10]
Partitioned table: select rows from all or the first several partition columns, filter columns, or count rows.
>>> df[:10]
>>> df[df.ds == '20160808']['f0', 'f1']
>>> df[(df.ds == '20160808') & (df.hh == 3)][:10]
>>> df[(df.ds == '20160808') & (df.hh == 3) & (df.mm == 15)]
Switch between local and production mode
Use a DEBUG flag to switch between local pandas execution and full MaxCompute execution:
>>> DEBUG = True
>>> if DEBUG:
>>> df = iris[:100].to_pandas(wrap=True)
>>> else:
>>> df = iris
Set DEBUG = True during development to download data locally. Set DEBUG = False before running in production to execute the full computation on MaxCompute.
Local execution and MaxCompute execution are not equivalent. Some programs that pass local debugging may fail on MaxCompute due to sandbox restrictions. Always test in the production environment before relying on local results.