A dashboard consolidates frequently used SQL queries into visual tiles. These tiles can be arranged into a single view that supports scheduled refreshes, global filters, and click interactions, eliminating the need to run the same queries repeatedly.
Overview
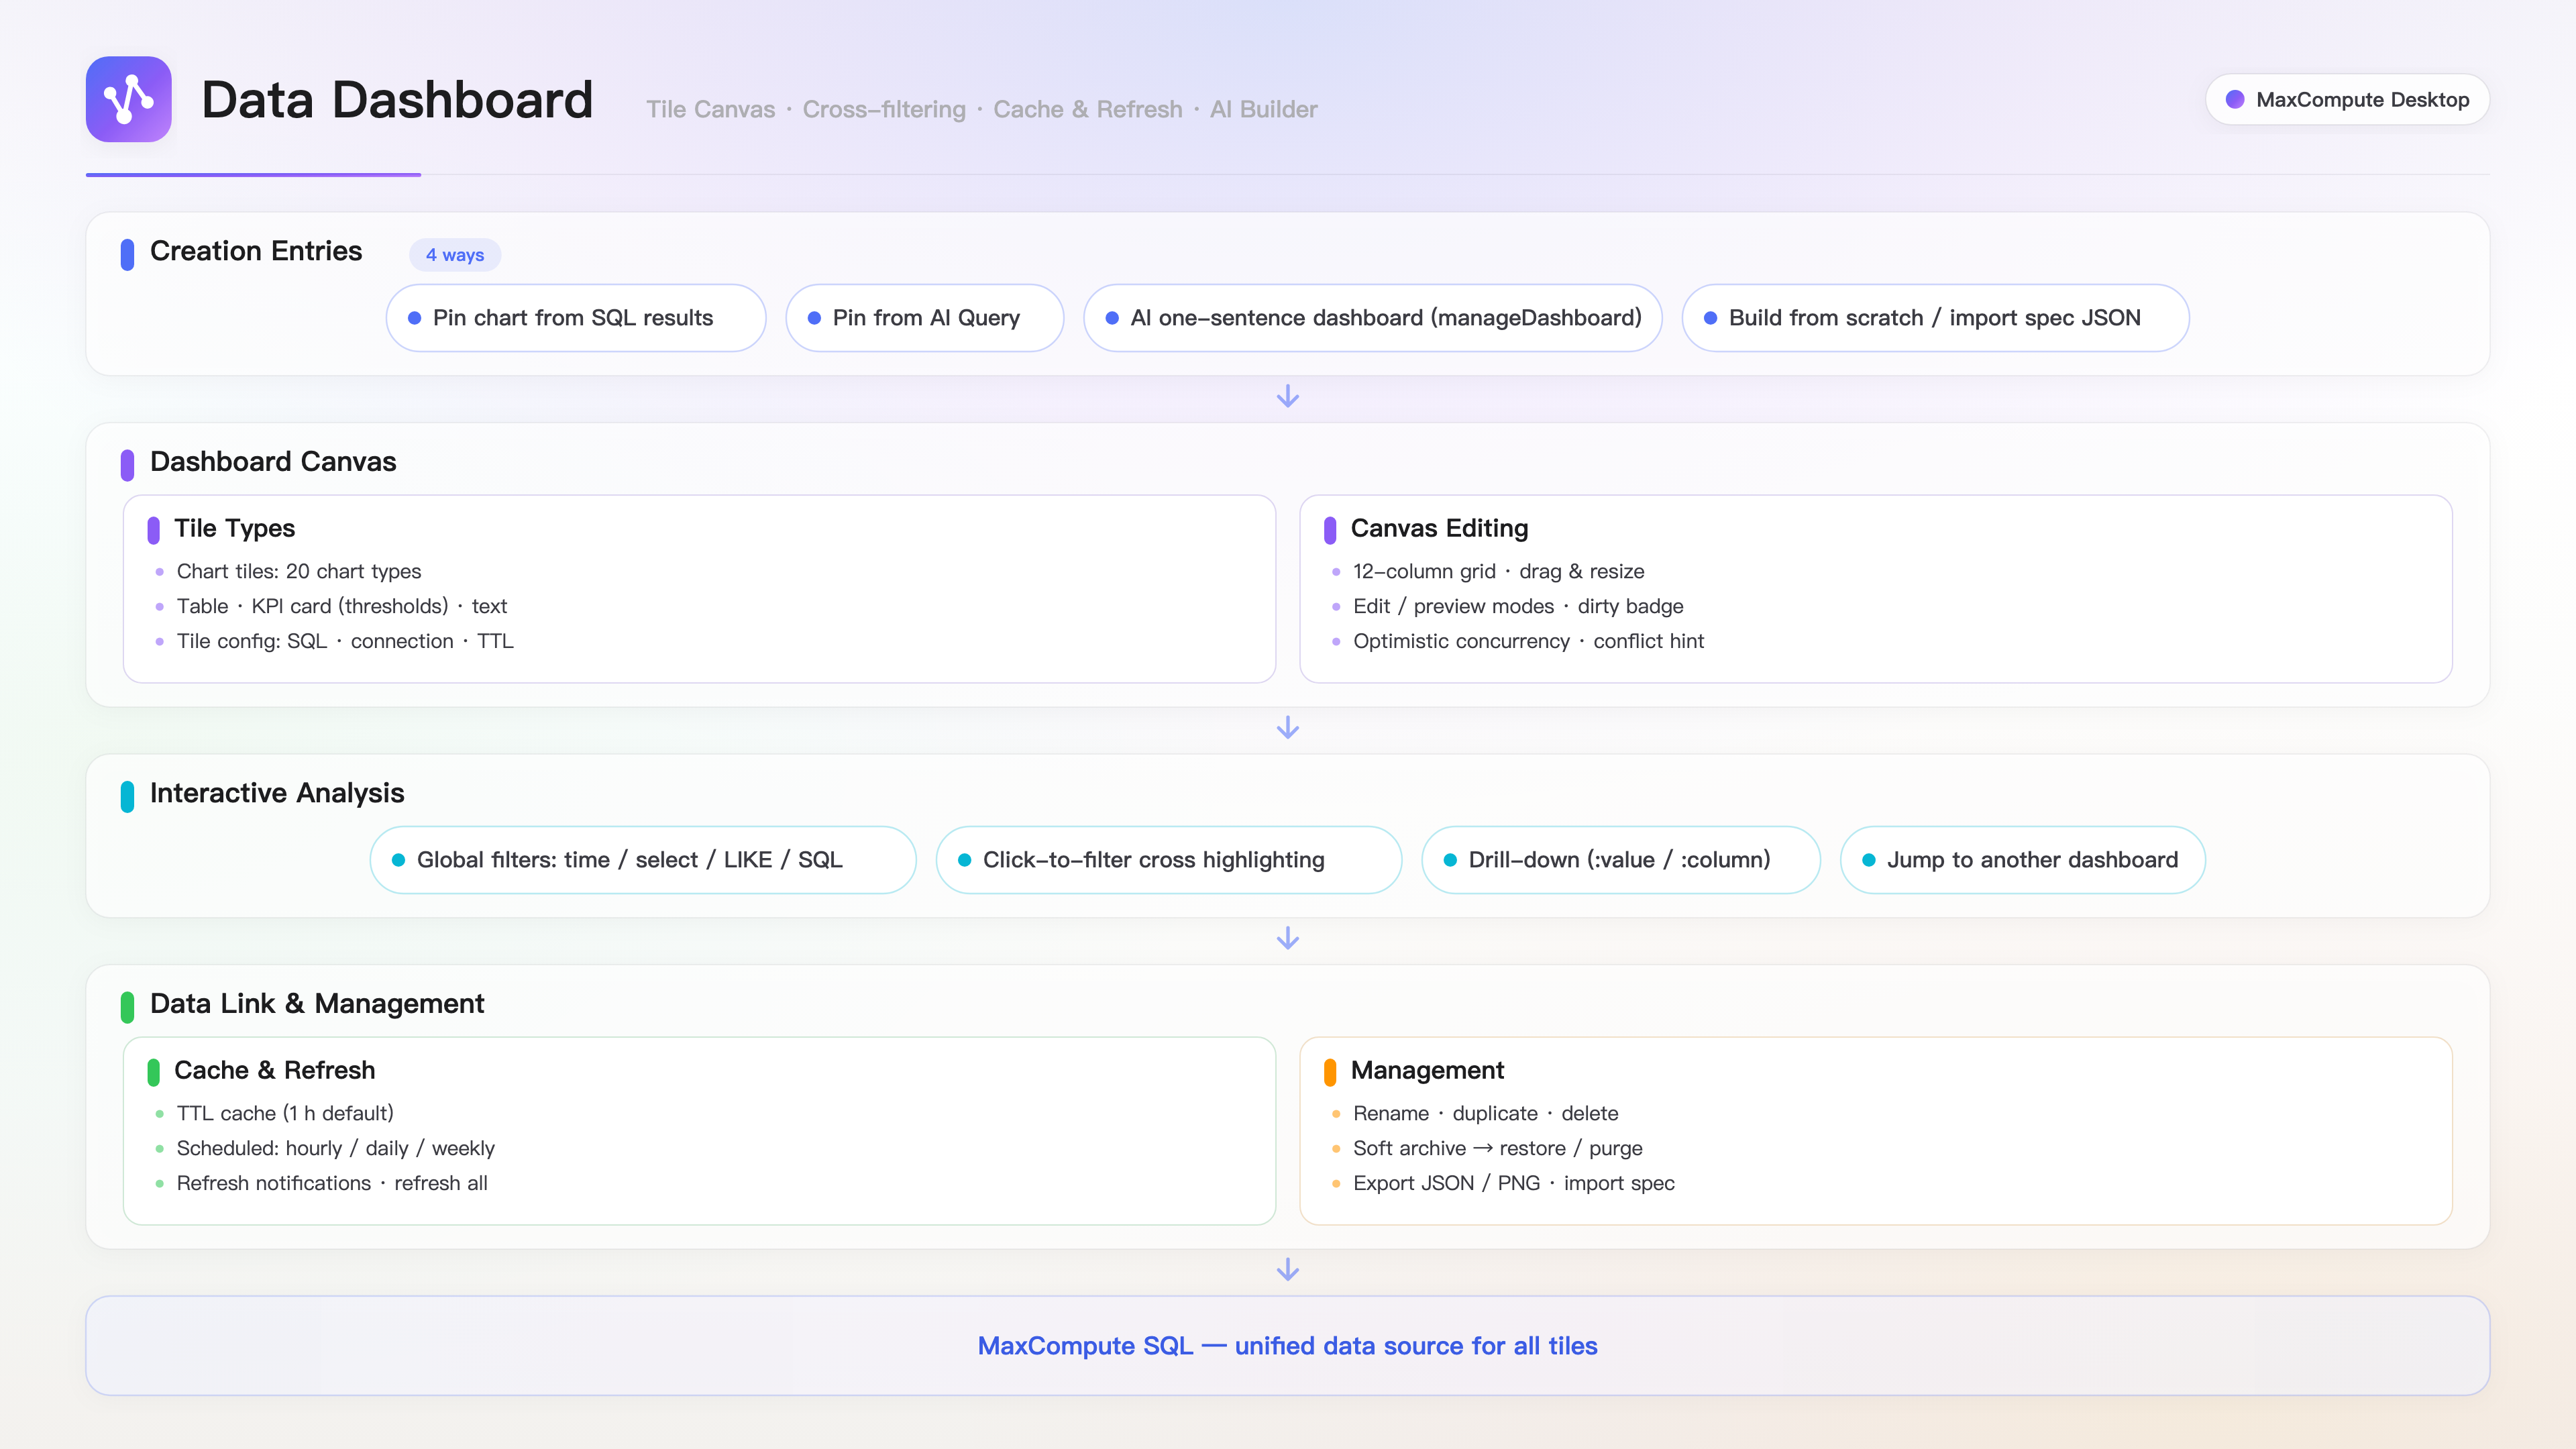
A dashboard consists of multiple tiles, where each tile corresponds to an SQL query and a specific visualization. The query results for each tile are stored in a TTL cache and can be configured for scheduled background refreshes. When you open a dashboard, it displays the cached results directly. Global filters allow you to change the filtering criteria for all tiles at once, and charts support click interactions and the ability to drill down to details.
Use cases
Daily business monitoring: Save core metric queries to a dashboard and schedule it to refresh at 8:00 AM every day. Your key metrics are ready to view for your morning meeting.
Multi-dimensional slice-and-dice analysis: Use global filters to switch between dimensions such as region, channel, and time. All charts update accordingly.
Locating anomalies: When you spot an anomaly in an overview chart, use click interactions to narrow the scope and then drill down to details at the row level.
Recurring reports: After completing an analysis in AI Query, pin the resulting charts to a dashboard and set up a scheduled refresh to create an automatically updating report.
Sharing analysis results: Export the dashboard as a full-page PNG for weekly reports, or export its specification (JSON) to let others replicate it.
Feature index
Category | Features |
Tile types | Charts, Tables, KPI cards, text |
Filtering and interaction | Global filters (7 types), click interaction, drill down to details, dashboard-to-dashboard navigation |
Refresh and cache | TTL cache, scheduled refresh, system notifications, forced refresh |
Management | create, rename, duplicate, archive and restore, import/export |
AI assistance | AI-powered dashboard creation, AI-powered tile addition, pin query results to a dashboard |
Prerequisites
You have created and successfully connected to a MaxCompute data source. When a tile's SQL query runs, it uses the connection bound to the dashboard.
Quick start
In the editor, run an SQL query, then switch to the chart view to configure the chart type and axes.
Click the Pin to dashboard button on the chart, select New dashboard, and enter a name.
The dashboard opens automatically. The SQL query, chart configuration, and connection information are saved with the tile.
Recommended workflow: First, refine your chart in the query editor, then pin it to a dashboard.
Dashboard layout and editing
Edit mode
Dashboards have two modes: View and Edit. Click Edit on the toolbar to enter edit mode. In this mode, you can:
Drag and drop tiles to adjust their position and size on the grid-based layout.
Add, delete, and configure tiles.
Add and edit global filters.
Edits are made on a working copy and do not affect other viewers until you save them. Click Save to apply your changes, or click Cancel to discard them.
Build a dashboard from scratch
In the dashboard panel on the sidebar, click New.
The dashboard opens automatically. Click Edit on the toolbar to enter edit mode.
Click Add tile, select a tile type, and enter the SQL in the configuration panel.
Adjust the layout by dragging the tiles, then click Save.
Tile types
Type | Purpose | Description |
Chart | Trends, proportions, comparisons, distributions | You can change the chart type in the configuration panel while in edit mode. |
Table | Detailed data display | Shows the query result rows and columns as-is. |
KPI card | Single core metric | Supports aggregations like sum, average, min, max, count, and first row. You can also configure units and formats. |
Text | Titles, descriptions | This tile supports Markdown for formatting. |
Supported chart types
Column chart, line chart, area chart, combination chart, pie chart, donut chart, scatter plot, bubble chart, horizontal bar chart, radar chart, histogram, box plot, waterfall chart, Sankey diagram, treemap, funnel chart, 2D heatmap, 3D column chart, 3D scatter plot, 3D surface plot, 3D heatmap, and KPI mini sparkline.
Tile configuration
In edit mode, select a tile to open its configuration panel, where you can set the following:
Title: The display name of the tile.
Connection: Inherits the dashboard's connection by default, but you can override it for each tile.
SQL: The data query for the tile.
Cache TTL: The duration for which the cache is valid, with a default of 1 hour.
Chart Type & Axes: Switch chart types and specify the fields for the X and Y axes.
KPI configuration: The value column, aggregation method, unit, and format.
Global filters
In edit mode, click Add filter. The filter appears at the top of the dashboard and you can adjust it at any time in view mode.
Filter types
Type | Scenario | Description |
Time Range | Filter by date | Supports presets like "Last 7 days," "Last 30 days," and "Last 90 days." Binding this filter to a partition column enables partition pruning. |
Single Select | Switch between regions, channels, etc. | Candidate values are automatically populated from the distinct results of the tiles. |
Multi-Select | View multiple categories at once | This filter uses a pop-up with checkboxes. |
Text | Fuzzy search | This filter performs a LIKE match. |
SQL Condition | Custom predicates | The condition is injected directly into the WHERE clause. Includes an enable/disable switch. |
Parameter | Adjustable controls | The |
Filter modes
Server-side filtering (Recommended): Place the
{{filters}}placeholder in the tile's SQL. The system compiles the filter conditions into predicates and injects them into the SQL to re-run the query. When a time range filter is bound to a partition column, it directly enables partition pruning.Client-side filtering: If the SQL does not contain a placeholder, the filter is applied to the already loaded result set without re-running the query. This is suitable for small result sets.
Cross-chart interaction and drill-down
Click interaction
In view mode, click a data point on any chart (for example, a single bar in a column chart):
An interaction tag appears at the top, showing the source tile and dimension value.
This automatically filters other tiles that contain the same column.
The source chart itself is not filtered, preserving the overall view.
Click the same data point again to cancel the interaction.
This is a client-side action that takes effect instantly without triggering a new query.
Drill-down
In the tile's configuration, click Add drilldown. Enter a detail query and use the :value or :column_name placeholder to reference the clicked value:
SELECT * FROM dwd_order_detail
WHERE region = :value AND ds >= '20260101'
LIMIT 100
In view mode, after clicking a data point on a chart, a View details option appears in the tile's menu. Clicking it opens a pop-up window displaying the results of the detail query.
Refresh and cache
Caching mechanism
Each tile's results are stored in a TTL cache, which is valid for 1 hour by default.
When you open a dashboard, it displays results directly from the cache if they are still valid. The system runs a new query only if the cache has expired.
Results for different filter conditions are cached separately, so switching between filters does not trigger redundant queries.
Click the Refresh button on a tile to refresh that single tile. Click Refresh all on the toolbar to force a refresh for all tiles.
From the tile menu, you can click Open Logview to view the job execution details in your browser, which helps you troubleshoot slow queries and resource consumption.
Scheduled refresh
Click Scheduled refresh on the toolbar to open the configuration dialog:
Frequency | Description |
Hourly | Specify the minute of the hour for execution. |
Daily | Specify the time of day for execution (e.g., 08:00). |
Weekdays | Runs at a specified time from Monday to Friday. |
Weekly | Select the day of the week and specify a time. |
Once a scheduled refresh is triggered, the system automatically re-runs the queries for all tiles in the background and updates the cache. Even if the dashboard tab is closed, the dashboard will load the latest data the next time you open it.
A scheduled refresh takes effect only while the application is running. If the application is not running, the system does not retry missed runs.
Refresh notifications
After a background refresh completes, a clickable toast notification appears, allowing you to navigate directly to the dashboard.
On the desktop client, you can enable System notification on refresh completion for each dashboard (via a switch in the scheduled refresh dialog). This allows you to receive system notifications even when the application is in the background.
The dashboard list displays the last refresh time for each entry. A failure icon appears if any tiles failed to refresh.
Pinning results to a dashboard
Pin from the SQL editor
After running an SQL query, switch to the chart view and adjust the chart type and configuration.
Click Pin to dashboard in the chart area.
In the dialog box, select a target dashboard (either an existing one or a new one) and click confirm.
The tile, along with its SQL, chart configuration, and connection information, is added to the target dashboard.
Pin from AI Query
You can also pin charts generated in an AI Query conversation. Click the Pin to dashboard button on the chart. The process is the same as pinning from the SQL editor.
Create dashboards with AI
Use natural language in an AI Query conversation to manage dashboards:
Create a dashboard: "Create a sales overview dashboard for me with a daily order trend and a pie chart of regional distribution." The AI automatically generates the SQL and chart configurations, creates the dashboard, and populates it with tiles.
Add a tile: "Add a refund rate line chart to the sales dashboard."
Refresh data: "Refresh all data in the sales dashboard."
Dashboard management
Dashboard list
The dashboard panel in the sidebar displays all your dashboards. Each entry shows the name, number of tiles, last update time, and refresh status. Hover over an entry to see options to Rename, Duplicate, and Delete.
Archive and restore
Deleting a dashboard moves it to the Archived collapsible section at the bottom of the list without losing any data. You can Restore dashboard at any time to move it back to the active list. Archived dashboards do not appear as targets when you pin a new tile. To permanently delete a dashboard, you must confirm the deletion again from within the archived section.
Export and import
Export
The Export menu in the toolbar provides two options:
Option
Output
Use case
Export as PNG image
A single, high-resolution, full-page image
Sharing in chats, adding to weekly reports, or using in presentations
Export specification (JSON)
The complete dashboard definition file
Backing up or sharing with colleagues to replicate the dashboard
Import
Click Import specification (JSON) at the top of the dashboard list panel to restore a dashboard. If the specification references a connection that does not exist on your local machine, the system will prompt you to reassign the connection in edit mode.