This topic describes the features and usage of LogView V2.0 (hereinafter referred to as LogView). You can access the URL of LogView to view job information.
Overview
LogView is used to record and display the status of MaxCompute jobs. LogView provides the following features:
-
Provides an interactive directed acyclic graph (DAG) to display the logical architecture of job processing. You can also view the operators of a job.
-
Allows you to play back the job running process.
-
Allows you to view memory usage and CPU utilization by using Fuxi Sensor.
Entry point
Submitting a MaxCompute job automatically generates a URL that starts withhttps://logview.aliyun.com/logview.
-
If you use the MaxCompute client to submit the job, you must copy the URL to the address bar of a browser to access LogView.
-
If you use DataWorks to submit the job, you can click the URL to directly go to the LogView page.
The LogView page is divided into three sections: the title and functionality section at the top (1), the Basic Info panel on the left (2), and the job details section on the right (3, which contains tab pages including Job Details, Result, SourceXML, SQL Script, and Summary, as well as the Progress Chart DAG diagram and Fuxi Jobs list).
|
No. |
Section |
|
1 |
The title and functionality section. For more information, see Title and functionality section. |
|
2 |
The Basic Info section. For more information, see Basic Info section. |
|
3 |
The job details section. For more information, see Job details section. |
Title and functionality section
This section shows the job ID and job name. The job ID uniquely identifies a MaxCompute job. The job ID is generated when you submit the job. The job name is displayed only if the job is submitted by using an SDK. You can also click the icons on the right of this section to perform operations.
|
Icon |
Description |
|
|
Open the Logview_detail.txt file that contains job details. The file is saved on your computer. |
|
|
Return to the LogView V1.0 page. |
|
|
Save the job details as a file to your computer. |


Basic Info section
This section shows the basic information about a job.
|
Parameter |
Description |
|
MaxCompute Service |
The endpoint of MaxCompute on which the job runs. For more information about endpoints, see Endpoints. |
|
Project |
The name of the MaxCompute project to which the job belongs. |
|
Cloud account |
The Alibaba Cloud account that is used to submit the job. |
|
Type |
The type of the job. Valid values: SQL, SQLRT, LOT, XLib, CUPID, AlgoTask, and Graph. |
|
Status |
The status of the job. Valid values:
|
|
Start Time |
The time at which the job was submitted. |
|
End Time |
The time at which the job is complete. |
|
Latency |
The period during which the job is run. |
|
Progress |
The progress of the job. |
|
Priority |
The priority of the job. |
|
Queue |
The position of the job in the queue in the resource quota group. |
Job details section
In the job details section, you can query details about a job. This section consists of the following tabs:
Job details
-
Progress chart
The upper part of the Job details tab displays the progress chart. The chart visualizes subtask dependencies across three layers: Fuxi job, Fuxi task, and operator. It also provides troubleshooting tools.
No.
Description
1
The breadcrumb navigation that is used to switch Fuxi jobs. JOB:_SQL_0_0_0_job_0 is the name of a Fuxi job.
2
The tool that is used to troubleshoot issues. You can use Progress Chart, Input Heat Chart, Output Heat Chart, TaskTime Heart Chart, and InstanceTime Heart Chart for troubleshooting.
3
You can click the
 icon to refresh the job status and click the
  icon to zoom in or out on the progress chart. You can also click the
  icon to obtain MaxCompute Studio documentation and the
  icon to switch to the upper level of the job.
 4
The zoom tool.
5
The Fuxi task. A MaxCompute job consists of one or more Fuxi jobs. Each Fuxi job consists of one or more Fuxi tasks. Each Fuxi task consists of one or more Fuxi instances. If the amount of input data increases, MaxCompute starts more nodes for each task to process the data. A node is equivalent to a Fuxi instance. For example, a simple MapReduce job generates two Fuxi tasks: map task (M1) and reduce task (R2). If an SQL statement is complex, multiple Fuxi tasks may be generated.
You can view the name of each Fuxi task on the execution page. For example, M1 indicates a map task. The 3 and 9 fields in R4_3_9 indicate that the map task can be run only after M3 and C9_3 are complete. Similarly, M2_4_9_10_16 indicates that the M2 task can be run only after R4_3_9, C9_3, R10_1_16, and C16_1 are complete. R/W indicates the numbers of rows that the task reads and writes.
Click or right-click a task to view the operator dependencies and operator graphs of the task.
You can quickly view the input and output tables.
6
The Fuxi task playback. You can click the
 icon to start or stop the playback. You can also drag the progress bar. The start time and end time are displayed on the sides of the progress bar. The playing time is displayed in the middle.
 7
The thumbnail.
Note-
The playback feature is not applicable to Fuxi tasks that are in the Running state.
-
An AlgoTask job, such as a Platform for AI (PAI) job, contains only one Fuxi task. Therefore, no progress charts are provided for these jobs.
-
For non-SQL jobs, only Fuxi jobs and Fuxi tasks are displayed.
-
If only one Fuxi job exists, the progress chart shows the dependencies among Fuxi tasks. If multiple Fuxi jobs exist, the progress chart shows the dependencies among the Fuxi jobs.
-
-
Job status
The lower part of the Job details tab displays the job's detailed execution information.
No.
Description
1
The Fuxi Jobs tab. You can switch Fuxi jobs on this tab.
2
The details about the Fuxi tasks of the Fuxi job. Click a Fuxi task to display information about the Fuxi instance of this task. By default, information about the Fuxi instance of the first Fuxi task for the first Fuxi job is displayed.
For AlgoTask and CUPID jobs, this area provides a Sensor column. You can click a Fuxi task's Sensor to view the CPU utilization and memory usage for its Fuxi instances. Fuxi jobs are classified as follows:
-
M: A job whose ID starts with M is a data scanning job.
-
R: A job whose ID starts with R is a Reduce job.
-
J: A job whose ID starts with J is a JOIN job.
-
C: A job whose ID starts with C indicates a virtual node. The node does not involve calculation and is used only for branch selection.
Note-
Fuxi Sensor is available in the China (Chengdu), China (Shenzhen), China (Shanghai), China (Hangzhou), China (Zhangjiakou), and China (Beijing) regions.
-
A Fuxi task may be retried if it is
interrupted. In this case, the Progress column shows the progress of only the retry attempt. Therefore, the overall job may be completed successfully while the progress of this Fuxi task is not100%. This is expected behavior.
3
LogView divides instances into groups based on their status. You can click the value next to Failed to query information about faulty nodes.
4
Fuxi instances.
-
An example ID is
M1#0_0. The first0is the auto-increment ID of the Fuxi instance. The second0is the task's retry count. A value of0indicates that the task was not retried. A value of n indicates that the task was retried n times. -
StdOut and StdErr. You can view the output messages, error messages, and information that you want to display. You can also download the information.
-
Debug. You can debug and troubleshoot errors.
-
Limits on the number of Fuxi instances.
The number of Fuxi instances is limited to 1 when the SQL statement that you use meets one of the following conditions:
-
It contains a
limitclause. -
It uses a window function without a
partition by keyclause. -
It uses an aggregate function without a
group by keyclause. -
No equi-join key is included in the SQL statement that is used to perform JOIN operations.
-
It contains an
order byclause.
-
-
Fuxi Sensor
Fuxi Sensor provides a multi-dimensional resource view of a Fuxi instance, showing its actual CPU utilization and memory usage. This makes it a valuable tool for root cause analysis and job performance analysis, such as in the following scenarios:
-
Analyze actual memory usage when an out-of-memory (OOM) error occurs.
-
View the following resource usage of a Fuxi instance for a machine learning job:
-
CPU utilization
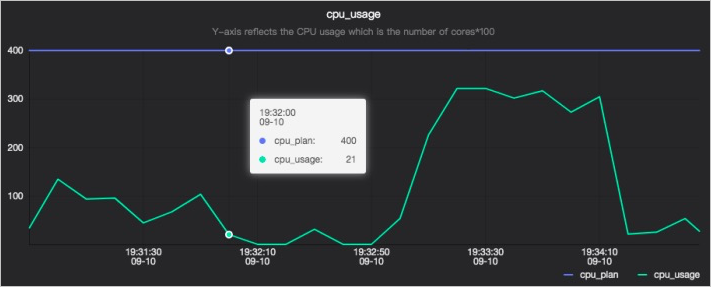
The cpu_usage chart has two lines. One line indicates the number of CPUs requested (cpu_plan), and the other line indicates the number of CPUs used (cpu_usage). In the y-axis, 400 indicates four processors. You can adjust the number of requested CPUs only by adjusting the number of processors. You cannot adjust the number of CPUs that can be used.
-
Memory usage
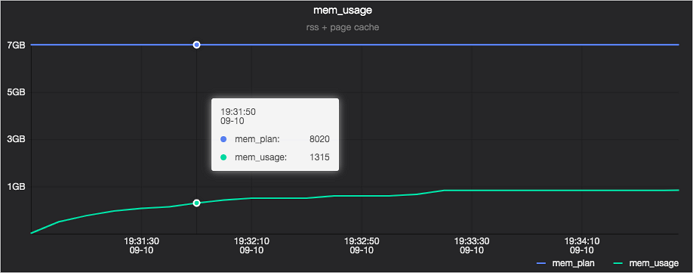
The mem_usage chart has two lines. One line indicates the number of memory resources requested (mem_plan), and the other line indicates the number of memory resources used (mem_usage).
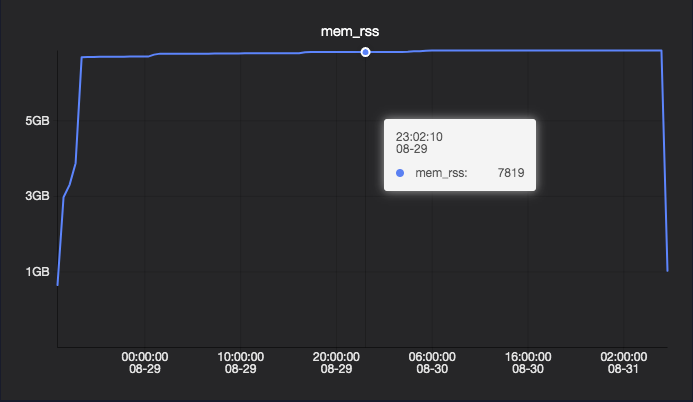
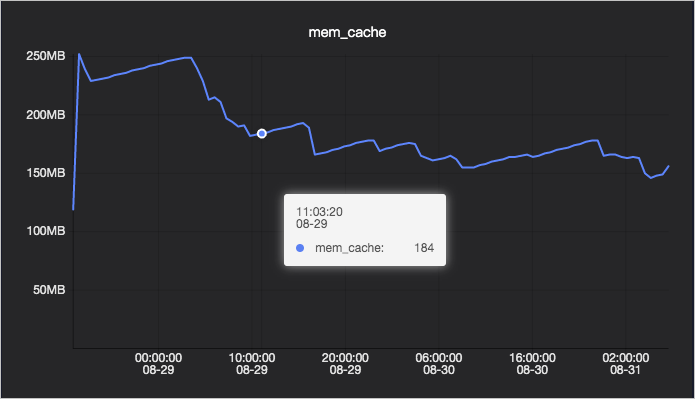
Memory usage (mem_usage) consists of two parts: Resident Set Size (RSS) and PageCache. RSS is the memory allocated after a page fault occurs due to a Malloc call (non-file mapping). This memory cannot be reclaimed when memory is scarce. PageCache is the memory used by the kernel to cache files, such as when reading and writing log files. PageCache can usually be reclaimed when memory is scarce.
-
Memory details
-
RSS usage
-
PageCache usage
-
-
Result
The content on the Result tab varies by job status:
-
If the job is successfully run, the job result is displayed.
-
You can use the following command to disable the display of the job result.
setproject odps.forbid.fetch.result.by.bearertoken=true; -
You can configure the odps.sql.select.output.format parameter to specify the result display format.
-- To display the result in the CSV format, set this parameter to csv.
set odps.sql.select.output.format=csv;
-- To display the result in the text format, set this parameter to HumanReadable.
set odps.sql.select.output.format=HumanReadable;
-
-
If the job fails to run, the cause of the failure is displayed.
Source XML
-
XML
Job levels and task-related information are displayed in the XML format on this tab.
-
Settings
The settings of the current task are displayed on this tab.
-
Command
The flag settings of the current task are displayed on this tab.
SQL script
The SQL script for the current task is displayed on this tab.
History
The history of the current task is displayed on this tab.
SubStatusHistory
The status of the current task is displayed on this tab.
Click the SubStatusHistory tab to view the sub-status history of each stage of task execution. The table contains the following columns: Code (numeric status code, such as 1010, 1020, and 1030), Description (status description), StartTime (start time), Latency (duration), and TimeLine (timeline progress bar).
|
Message for status code |
Description |
|
Waiting for scheduling |
The job is submitted and is waiting for the MaxCompute framework to schedule. In most cases, the waiting time is short. |
|
Waiting for cluster resource |
The job is waiting for resources because the MaxCompute framework identifies that the resources of the Fuxi computing cluster are insufficient. |
|
Waiting for concurrent task slot |
The project-level throttling is triggered. You can configure the number of SQL tasks that can be submitted at the same time for a project. |
|
Waiting for data replication |
The job is waiting for data to be replicated. |
|
Waiting for execution slot |
The system-level throttling is triggered. |
|
Waiting for cleaning up of previous task attempt |
The job is waiting for the cleanup operation of historical tasks to be complete. |
|
Waiting for execution |
The job is waiting to be distributed from the parent process queue to a child process. In most cases, the waiting time is short. |
|
Preparing for execution |
The job is going to be distributed to a child process. If the child process is abnormal, the preparation time may be long. |
|
Task is executing |
The job is being processed in the MaxCompute framework. |
|
SQLTask is initializing |
The SQL task is being initialized. |
|
SQLTask is compiling query |
The SQL task is being compiled. |
|
SQLTask is optimizing query |
The SQL task is optimizing queries. If the execution plan is complex, the optimization time is slightly long. If the optimization time is excessively long, an error may occur. |
|
SQLTask is splitting data sources |
The SQL task is splitting data sources for optimization. |
|
SQLTask is generating execution plan |
The SQL task is generating an execution plan. If this process tasks a long period of time, data may be read from an excessive number of partitions or small files. |
|
SQLTask is submitting execution plan |
The SQL task is submitting the execution plan. |
|
Job has been submitted |
The job is submitted to the computing cluster. |
|
Offline Job Waiting for running |
Before the job is submitted to the Fuxi computing cluster, the MaxCompute framework identifies that computing resources are available for the job. However, after the job is submitted, the MaxCompute framework identifies that no computing resources are available in the quota group. As a result, the job waits for computing resources. This status code appears only once and no longer appears even if no computing resources are available for the job. |
|
Offline Job is running |
The Fuxi job is running. If resources become unavailable during execution, the job remains in this state. For example, if a higher-priority job preempts resources, the affected Fuxi instances cannot run and their status changes to |
|
Offline Job is failed |
The Fuxi job fails to run. |
|
Offline Job is succeed |
The Fuxi job is successful. |
|
SQLTask is updating meta information |
The SQL task is updating the metadata information status and generating dynamic partitions. This process may be time-consuming. |
|
SQLTask is finishing |
The SQL task is complete. |
|
Online Job is cancelled by fuxi |
The job in |
|
Task rerun |
The job is being retried. This can happen if a job in |
|
Online Job Waiting for running |
The job in |
|
Online Job is running |
The job in |
|
Online Job is failed |
The job in |
|
Online Job is succeed |
The job in |
|
Online Job is cancelled by fuxi |
The job in |
|
Task key-path executing finished |
The key path of the job is complete, but information such as DetailStatus is not generated. |
|
Task key-path is finished |
The key path of the job is complete. |
|
Instance key-path is finished |
The key path of the instance is complete. |
|
Task execution is finished |
The job is complete, and DetailStatus is generated. |
|
Instance execution is finished |
The job is complete. |
|
Execution failed |
The job fails to run. |