Log Audit Service provides built-in alert rule templates. If you want to monitor Log Audit Service in real time, you need to only create an alert rule from a template. This topic describes how to create an alert rule.
Prerequisites
The audit feature is enabled for the required cloud services on the Global Configurations page. For more information, see Enable and manage log collection.
Background information
Log Audit Service provides the following built-in resources for alerting: alert rule templates, SLS audit builtin alert policy, SLS audit builtin action policy, SLS audit builtin user group, and SLS audit builtin content template. Before you use the built-in resources, take note of the following items:
A built-in alert rule template uses the built-in alert policy.
NoteThe built-in alert rule templates of Log Audit Service are associated with the built-in alert policy. You can change the settings based on your business requirements.
The built-in alert policy uses the built-in action policy.
The built-in action policy uses the built-in user group and built-in alert template.
Procedure
Log on to the Simple Log Service console.
In the Log Application section, click the Audit & Security tab. Then, click Log Audit Service.
In the left-side navigation pane, click Audit Alert. Then, choose Policy Settings > Alert Rules.
On the Alert Rules tab of the Alert Center page, click Create Alert. In the Create Alert panel, click Create from Template.
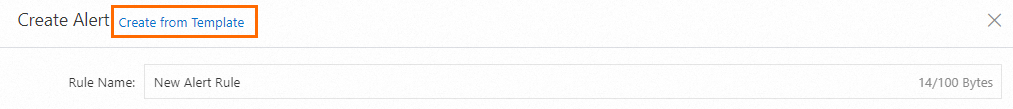
Select the template that you want to use, configure the parameters, and then click OK.
For more information about the parameters, see Create an alert rule for logs.
What to do next
Operation | Description |
Disable an alert rule | If you disable an alert rule, the value in the Status column of the alert rule changes to Disabled, and alerts are no longer triggered based on the alert rule. The configurations of the alert rule are not deleted. If you want to enable the alert rule again, you do not need to reconfigure the parameters of the alert rule. |
Pause an alert rule | If you pause an alert rule, alerts are not triggered based on the alert rule within a specified period of time. |
Resume an alert rule | You can resume a paused alert rule based on your business requirements. |
Delete an alert rule | The configurations of the alert rule are deleted. The configurations include the Alibaba Cloud account that is used to create the alert rule. If you want to enable the alert rule again, you must reconfigure the parameters of the alert rule. |